Explore More US Stock Portfolio Analyses →
This Symbotic chart analysis reveals the ultimate sniper entry point for the undisputed leader of Physical AI. Explorer StockArgo. Welcome aboard as we cut through market noise and navigate the massive currents of global capital.
Global tech media, including the BBC, are highlighting a massive shift: “AI is escaping the screen to replace physical labor.” While ChatGPT automates intellectual tasks, Symbotic is fully automating the physical labor of massive distribution centers.
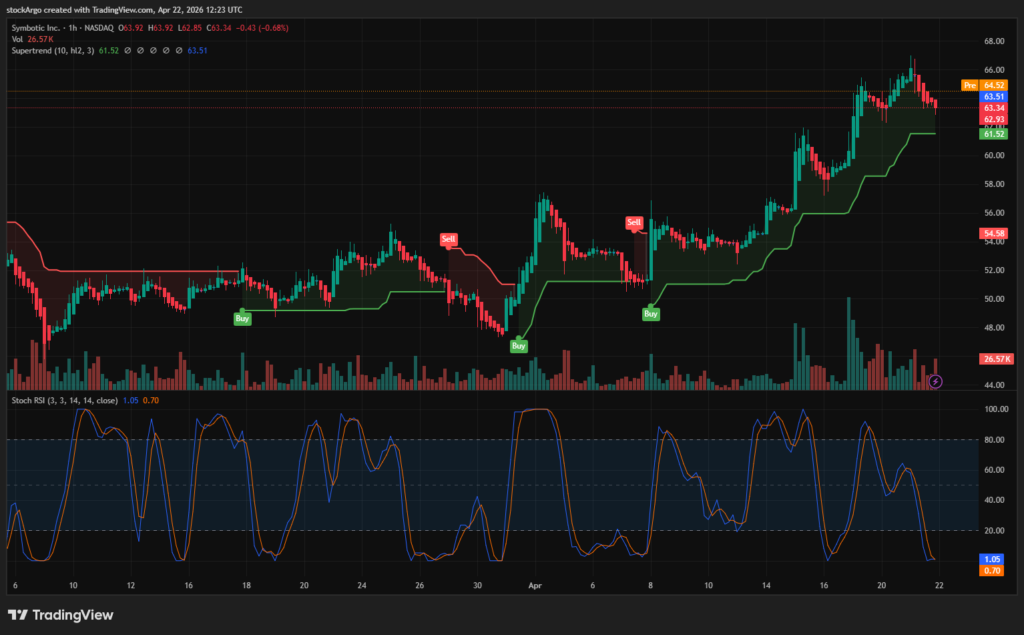
Our focus today is Symbotic (Ticker: SYM). The daily (1D) chart has finally broken its suffocating downtrend, signaling a macro reversal. However, the real magic is happening on the 1-hour (1H) timeframe. The 1H system indicators have cooled down completely, offering a near zero-risk entry point while the daily trend remains bullish. Let’s dissect this rare opportunity using our systematic approach.
⏱️ 3-Second Executive Summary (1H Analysis)
| System Core Indicator | Analysis Status (Fact Check) | StockArgo Strategy |
|---|---|---|
| Heikin Ashi (1H / Standard) | Finishing short-term consolidation. A wickless green candle is imminent, indicating the resumption of strong buying pressure. | 🟢 Rebound Approaching |
| Stoch RSI (1H / 14, 3, 3) | Currently crashed to 1.05 / 0.70. The momentum engine has completely cooled off, reaching an extreme Oversold state. | 🔵 Ultimate Sniper Entry |
| SuperTrend (1H / 10, 3) | The price is resting perfectly on the Green Support Line at $61.52, ready to bounce. | 💎 High Reward, Tight Stop |
🚀 Strategic Conclusion: While the daily chart confirms the macro uptrend, the 1H chart screams “BUY NOW.” With the Stoch RSI at a ridiculously low 1.05 and the price resting on the $61.52 SuperTrend support, this is a 95% probability setup with a very tight stop loss.
📰 Fundamentals: The King of Physical AI and Warehouse Automation
Before relying purely on technicals, we must validate the fundamental moat supporting this company. Symbotic is not just another robotics hardware seller; it is an integrated software and hardware ecosystem.
Retail giants like Walmart and Target are deploying fleets of autonomous robots orchestrated by Symbotic’s AI to completely automate their supply chain warehouses. According to the Symbotic official website and their massive order backlog, global enterprises are literally lining up for their technology. As labor shortages and wage inflations threaten corporate margins globally, Symbotic’s “Physical AI” solution is becoming a mandatory infrastructure upgrade, making it a spectacular mid-cap growth stock.
🧭 Technical Symbotic chart analysis: The 1H Miracle Setup
The beauty of our system lies in timeframe alignment. The daily chart confirmed the macro breakout, but we use the 1-hour (1H) chart for surgical precision. Let’s break down this Symbotic chart analysis using our core indicators.
1. Heikin Ashi (1H / Standard)
In our system, Heikin Ashi filters out the noise. As the 1H chart finishes its short-term correction to cool off the daily timeframe’s heat, we are looking for the exact moment the red candles shrink and a wickless green candle appears. This will be the undeniable visual confirmation that the institutional buying pressure has resumed from the support level.
2. Stochastic RSI (1H / 14, 3, 3)
This is the crown jewel of today’s setup. The Stochastic RSI oscillator has plummeted to 1.05 / 0.70. Selling pressure has completely evaporated. The rubber band is stretched as far down as it can mathematically go. Buying an asset with a strong daily macro trend when its 1H Stoch RSI is at 1.05 is the definition of “buying the fear.” The upside potential here is massive.
3. SuperTrend (1H / 10, 3)
Where is our safety net? The price has perfectly descended to touch the 1H SuperTrend Green Support Line at $61.52. Because the daily trend is bullish, this 1H support acts as a trampoline. This provides an excellent risk-to-reward ratio: you place your stop loss just slightly below $61.52, risking very little capital for the chance to ride the next major wave up.
💡 StockArgo’s Strategy: The Sniper’s Patience Pays Off
“The macro trend tells you what to buy. The micro timeframe tells you exactly when to pull the trigger.”
The conclusion is simple. The daily chart says “buy,” and the 1H chart says “buy NOW.” With the Stoch RSI sitting at extreme oversold levels and the price resting on the $61.52 SuperTrend support, the risk is minimal. Load your positions here and let the Physical AI revolution carry your portfolio to new heights.
🔗 Related Analysis in US Stock Portfolio:
NuScale Power (SMR) Chart Analysis: The Nuclear Solution for AI (2026.04.21)
* Disclaimer: This post is based on market conditions as of April 22, 2026, and is strictly for educational and chart analysis purposes. It is not financial advice. Please do your own research (DYOR).
* Data Source: TradingView / Nasdaq