Explore More US Stock Portfolio Analyses →
Explorer StockArgo. Welcome to our digital bridge, where we navigate the complex currents of the stock market. Today, we focus our SentinelOne (S) chart analysis on the rising star of AI-driven cybersecurity within our [US Stock Portfolio].
As AI infrastructure expands, the “software shield” protecting it becomes priceless. While Nvidia provides the compute, SentinelOne provides the autonomous defense required to protect that data.
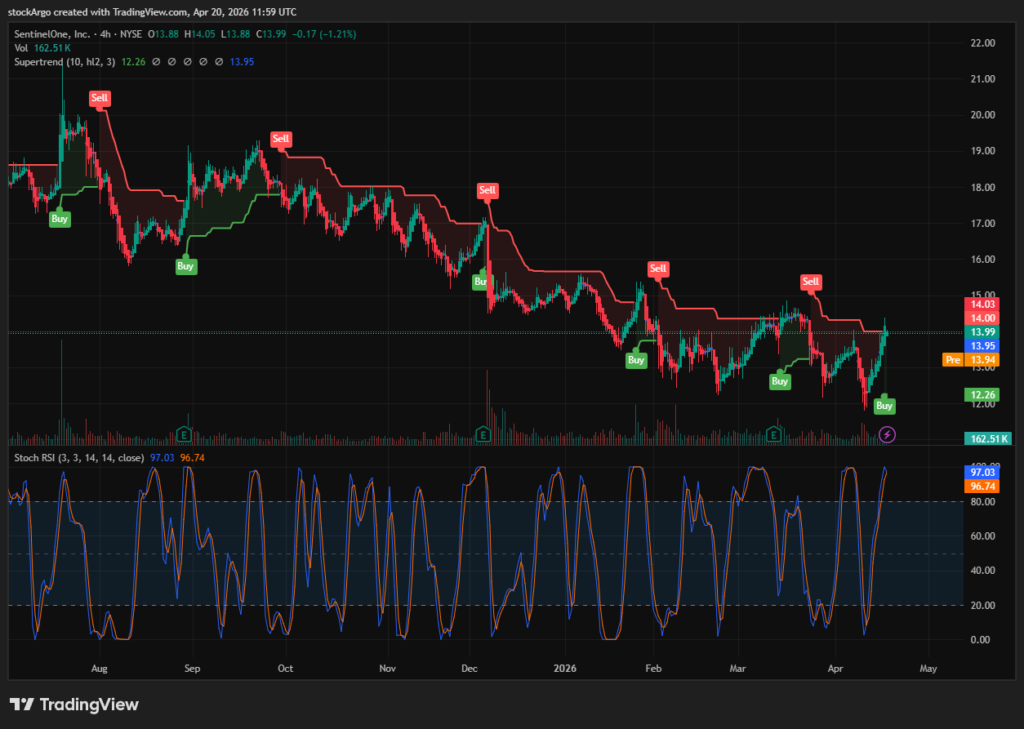
In this SentinelOne (S) chart analysis, we are moving away from the “hopeless” daily chart to find actionable insights on the 4-hour (4H) timeframe. We have detected a significant trend reversal signal that could mark the beginning of a macro bottom. Let’s use our professional system indicators to decode this momentum shift without emotional bias.
⏱️ 3-Second Executive Summary (4H Analysis)
| System Core Indicator | Analysis Status (Fact Check) | StockArgo Strategy |
|---|---|---|
| Heikin Ashi (4H / Standard) | Formation of massive green bodies with zero lower wicks. This indicates buyers have completely taken over. | 🟢 Strong Buying Power |
| Stoch RSI (4H / 14, 3, 3) | Currently pegged at 100.00 / 100.00. The momentum is at a critical overheat (Extreme Overbought). | 🔴 Strict Wait Zone |
| SuperTrend (4H / 10, 3) | Successfully broke the long-term resistance and flipped to Green (Buy). A fresh uptrend has begun. | 🔵 Trend Flip Confirmed |
🚀 Strategic Conclusion: The 4H reversal is a technical fact. However, with Stoch RSI at 100, buying now is high risk. We must wait for the overbought condition to cool down and retest the SuperTrend support line.
📰 Fundamentals: AI Security Moat in the Infrastructure Era
A comprehensive SentinelOne (S) chart analysis requires an understanding of the business logic. SentinelOne isn’t just another antivirus company; it is a pioneer of behavioral AI security.
Unlike legacy solutions, SentinelOne’s Singularity Platform uses autonomous AI agents to protect endpoints by analyzing behavioral patterns in real-time. This is critical for defending against modern zero-day attacks that bypass traditional signature-based security. As the AI supercycle shifts from hardware to software implementation, mid-cap leaders like SentinelOne (S) possess the agility and technological edge to outperform larger, more sluggish competitors in the cybersecurity sector.
🧭 Technical System Analysis: Decoding the 4H Micro-Reversal
Our SentinelOne (S) chart analysis focuses on the 4-hour (4H) timeframe to identify the earliest entry points before the broader market catches on.
1. Heikin Ashi (4H / Standard)
The Heikin Ashi candles are the purest way to visualize trend strength. After weeks of selling pressure, the 4H chart has produced a sequence of wickless green candles. This confirms that the average price is moving upward with significant volume support, signaling that the “path of least resistance” has shifted to the upside.
2. Stochastic RSI (4H / 14, 3, 3)
This is our primary risk management tool. Our SentinelOne (S) chart analysis reveals that the Stoch RSI is currently locked at 100.00. This indicates extreme momentum fatigue. Buying at a 100 RSI often leads to immediate drawdowns. Discipline is required to wait for the indicator to descend back toward the 20 level before taking a position.
3. SuperTrend (4H / 10, 3)
The SuperTrend indicator is the final confirmation of our SentinelOne (S) chart analysis. By flipping from a red resistance line to a green support line, it tells us that the short-term structure is now bullish. The key target for a pullback entry is the area immediately above this new green support line, where the risk-to-reward ratio is most favorable.
💡 StockArgo’s Strategy: The Power of the Pullback
“The trend tells you where the ship is going, but the pullback tells you when to board.”
In conclusion, our SentinelOne (S) chart analysis confirms a bullish breakout on the 4H chart. However, successful trading is about timing. We are waiting for the Stoch RSI to cool off. When the price dips to test the SuperTrend support line while the RSI is in the oversold zone, we will have a high-conviction “Buy the Dip” opportunity. Stay patient and follow the system.
🔗 Related Analysis in US Stock Portfolio:
Breaking the Silicon Ceiling: IonQ (IONQ) Stock Buy Timing & Chart Analysis (2026.04.17)
* Disclaimer: This post is based on market conditions as of April 20, 2026, and is strictly for educational purposes. It is not financial advice. Please do your own research (DYOR).
* Data Source: TradingView / Nasdaq