Explore More US Stock Portfolio Analyses →
This Palantir chart analysis uncovers the mechanical cooling phase following the recent Reddit-fueled frenzy, providing a strategic roadmap for the next entry point. Explorer StockArgo. Welcome as we cut through the noise of the retail crowd to navigate the deep currents of systemic algorithms and institutional capital.
“When the crowd cheers and rushes in blindly, the professional hunter waits for the fire to cool.” Palantir, the dominant force in national security and B2B AI software, has entered a necessary price correction within its broader macro uptrend.
Our focus for the US Stock Portfolio today is Palantir (Ticker: PLTR). On the daily (1D) chart, we are observing a classic divergence between retail sentiment and systemic reality. While social media forums like Reddit (WSB) are filled with calls for a “moon mission,” our three core system indicators are flashing a coordinated cooling signal. Let’s strip away the emotion and dissect where the next high-probability “buy the dip” opportunity lies.
⏱️ 3-Second Executive Summary (Daily Analysis)
| System Core Indicator | Analysis Status (Fact Check) | StockArgo Strategy |
|---|---|---|
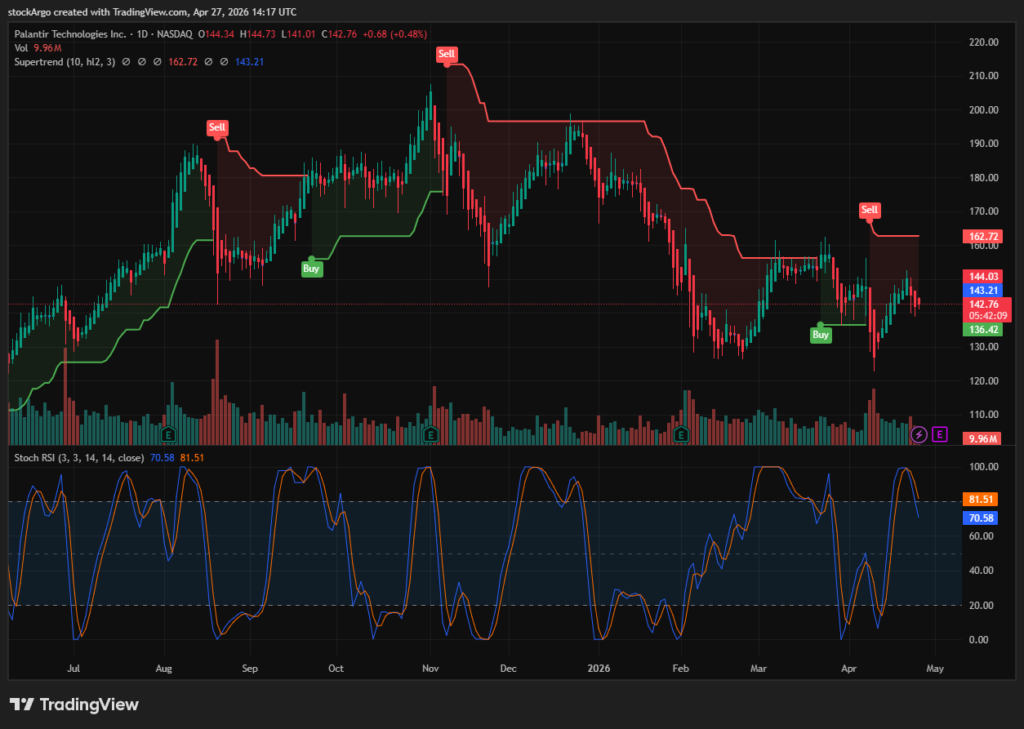
| Stoch RSI (Daily 1D / 3, 3, 14, 14) | Currently at 70.37 / 81.44. A clear death cross has formed as the K-line drops below the D-line from the overbought ceiling. | 🔴 Postpone New Entries |
| Heikin Ashi (Daily 1D / Standard) | The green bullish rally has paused, replaced by red bearish candles signaling a shift in short-term momentum. | 🔵 Short-term Cooling Phase |
| SuperTrend (Daily 1D / 10, hl2, 3) | A formidable Red (Sell) resistance line is established at $162.72, acting as a structural ceiling for the current price. | 💎 Wait for Support Test |
🚀 Strategic Conclusion: This is a healthy “breather” before the next potential leg up. Contrary to the retail hype, indicators suggest a cooling period is underway. Avoid chasing at the current $142 level; instead, exercise the patience of a hunter and wait for the Stoch RSI to hit the oversold floor (0-20) before initiating new positions.
📰 Fundamentals: The Sovereign of AI Software in Defense and Enterprise
To avoid being shaken by short-term chart fluctuations, one must validate the core fundamentals of the business. Why does the Reddit community maintain such a cult-like following for this stock? Let’s examine the outbound facts.
Palantir is more than just a software company. According to the official Palantir Technologies portal and major defense reports, their Artificial Intelligence Platform (AIP) is currently integrating into the core operational networks of the U.S. Department of Defense. Furthermore, their reach into the commercial B2B sector is expanding at an unprecedented rate. Enterprises have realized that without Palantir’s “operating system for the modern enterprise,” they cannot effectively deploy large-scale AI. This unique moat and solid earnings profile suggest that the current daily chart consolidation is not a trend reversal, but a “coiling of the spring” for a higher jump.
🧭 Technical Palantir chart analysis: Waiting for the Perfect Pullback
Even with great fundamentals, buying at the wrong price leads to unnecessary drawdowns. Our Palantir chart analysis ignores sentiment to identify the safest, most logical entry levels based on the system.
1. Stochastic RSI: The Death Cross and the Cooling Signal
[System Setting: Daily 1D / 3, 3, 14, 14]
This is the primary reason to pause today’s hunt. After hovering at the 100.00 ceiling, the Stochastic RSI has recorded a 70.37 / 81.44 split, triggering a death cross as the K-line cuts below the D-line. This mechanically proves that the short-term buying momentum has peaked and smart money (institutions) is taking profits. Hands off the trigger until this blue line reaches the 0-20 oversold floor.
2. Heikin Ashi: The Transition to Red Bearish Momentum
[System Setting: Daily 1D / Standard]
The Heikin Ashi candles, which filter out market noise, have ended their green streak and are now printing consecutive red bearish candles. The thickening of these candle bodies suggests that downward pressure may persist for the coming days. Do not try to catch a falling knife with your bare hands.
3. SuperTrend: The Formidable $162.72 Ceiling
[System Setting: Daily 1D / 10, hl2, 3]
Above the current price of approximately $142 sits a Red (Sell) SuperTrend line at $162.72. This acts as a significant structural barrier. Breaking through this ceiling in one go is unlikely without a massive catalyst. Instead, look toward previous support zones in the $120-$130 range as the likely destination for this healthy pullback before the next breakout attempt.
💡 StockArgo’s Strategy: Patience as an Aggressive Investment
“While the crowd is screaming as they hit the $162 ceiling, we observe. When the indicators reach the floor and blood is in the streets, that is when we hunt.”
In conclusion, our Palantir chart analysis suggests that PLTR is currently in a “cooling” phase. Do not fall victim to FOMO. Wait for the Stochastic RSI to hit rock bottom and for wickless green Heikin Ashi candles to reappear. This patient, systemic approach is the only way to ensure you join the macro uptrend at a price that maximizes your safety and potential returns.
🔗 Related Analysis in US Stock Portfolio:
Astera Labs (ALAB) Chart Analysis: The Insane Breakout Rally Resolving AI Bottlenecks (2026.04.24)
* Disclaimer: This post is based on market conditions as of April 27, 2026, and is strictly for educational and chart analysis purposes. It is not financial advice. Please do your own research (DYOR).
* Data Source: TradingView / Nasdaq