Explore More US Stock Portfolio Analyses →
This MicroStrategy chart analysis targets the exact intersection of Reddit-driven volatility and systemic oversold signals on the 1-hour timeframe. Explorer StockArgo. Welcome as we cut through the noise of the retail crowd to navigate the massive currents of digital capital.
“The ultimate Bitcoin proxy and a favorite of the WallStreetBets community, MSTR continues to define high-stakes trading.” MicroStrategy has transitioned from a software company to a massive Bitcoin holding entity, making its stock a high-leverage bet on the crypto market.
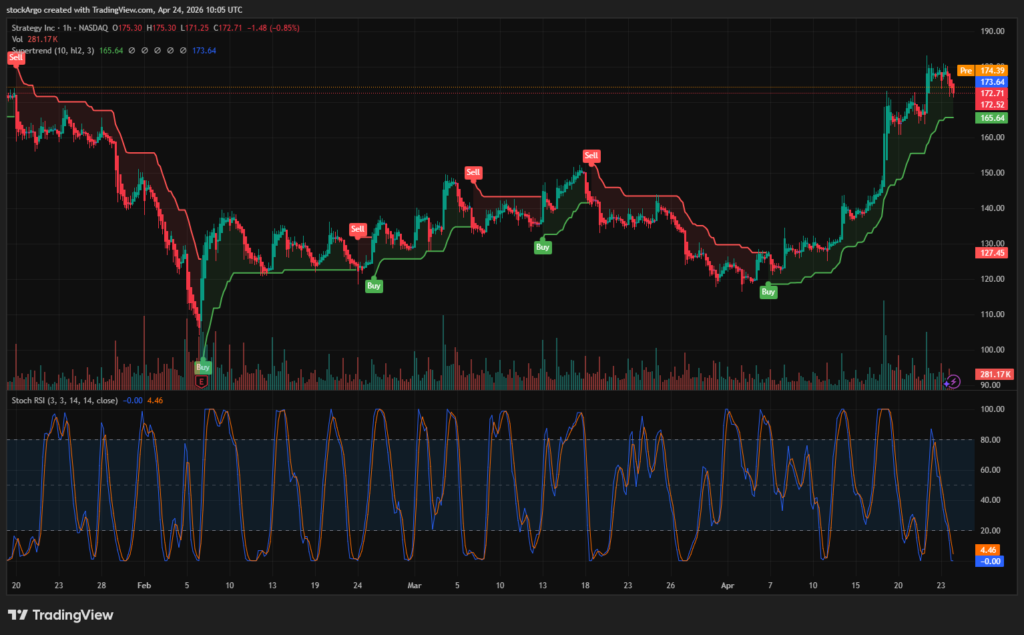
Our focus for the US Stock Portfolio today is MicroStrategy (Ticker: MSTR). On the 1-hour (1H) chart, we have detected a rare mathematical phenomenon: the Stochastic RSI has plummeted to an absolute floor of -0.00. While the broader daily trend remains intact, this micro-level exhaustion presents a surgical entry point for those seeking to capture the next “meme-fueled” bounce. Let’s dissect the system indicators to find our defensive line.
⏱️ 3-Second Executive Summary (1H Setup)
| System Core Indicator | Analysis Status (Fact Check) | StockArgo Strategy |
|---|---|---|
| Stoch RSI (1H / 3, 3, 14, 14) | Currently at -0.00 / 4.46. The indicator has reached its mathematical limit, signaling extreme Oversold conditions. | 🔵 Sniper Entry Triggered |
| SuperTrend (1H / 10, hl2, 3) | Holding a firm Green (Buy) support at $165.64. The price is currently testing this level for a potential trampoline bounce. | 🟢 Safe Stop-Loss Level |
| Heikin Ashi (1H / Standard) | Currently showing red candles as it cools down from the recent peak. Approaching the critical $165.64 support zone. | 💎 Accumulation Phase |
🚀 Strategic Conclusion: This is an exceptional setup for a short-term swing. With the Stoch RSI hitting a literal zero and the price descending toward the 1H SuperTrend support at $165.64, the risk-to-reward ratio is highly skewed in favor of buyers. Expect a sharp reversal as retail volume returns to defend the support.
📰 Fundamentals: The Bitcoin Proxy Loved by Reddit
Before pulling the trigger based on any MicroStrategy chart analysis, we must understand why the Reddit community is so obsessed with this ticker. MSTR is no longer judged by its business analytics software; it is valued as a leveraged Bitcoin play.
As detailed on the MicroStrategy (MSTR) official investor portal, the company holds more Bitcoin than any other public corporation in the world. This creates a unique ecosystem where retail traders on Reddit use the stock to gain outsized exposure to crypto price movements. The high short interest often seen in MSTR also opens the door for legendary short squeezes, which are frequently coordinated in forums like r/wallstreetbets. This immense retail liquidity ensures that when our system indicators hit extreme levels, the subsequent price reaction is often explosive.
🧭 Technical MicroStrategy chart analysis: The Power of -0.00 RSI
In high-volatility environments, emotions are your worst enemy. Our system-based MicroStrategy chart analysis relies strictly on mechanical signals to navigate the madness. The 1-hour chart is currently offering a setup that is rarely seen.
1. Stochastic RSI: Absolute Mathematical Exhaustion
[System Setting: 1-hour 1H / 3, 3, 14, 14]
The most striking feature of the current chart is the Stochastic RSI. The K-line has reached -0.00, which is the literal floor for this oscillator. This indicates that the short-term selling pressure is not just high—it is mathematically exhausted. Historically, when MSTR hits this level on the 1H chart during a macro uptrend, a rapid “V-shaped” recovery follows almost immediately as buyers step back in.
2. SuperTrend: The $165.64 Defensive Line
[System Setting: 1-hour 1H / 10, hl2, 3]
An oversold RSI is not enough; we need a floor. The 1H SuperTrend is providing a solid Green (Buy) support at $165.64. This level has acted as a trampoline in previous sessions. As the price drifts toward this line, it creates a “low-risk, high-reward” entry. You can place your stop-loss just a fraction below $165.64, risking a small amount of capital for a potential double-digit percentage bounce.
3. Heikin Ashi: Filtering the Retail Noise
[System Setting: 1-hour 1H / Standard]
Heikin Ashi candles are currently red, showing the intensity of the current pullback. However, as the candles approach the $165 support, we are looking for the shrinkage of the candle bodies. The moment a green candle with no lower wick appears on this 1H support, it will be the final visual confirmation that the Reddit-fueled rally is resuming.
💡 StockArgo’s Strategy: Riding the Crowd’s Conviction
“The crowd provides the fuel, but the chart provides the map. Follow the -0.00 signal to victory.”
In conclusion, our MicroStrategy chart analysis reveals a surgical entry opportunity. Do not be intimidated by the volatility; instead, embrace it through the lens of the system. With the Stoch RSI at zero and the $165.64 support acting as a safety net, this is the time to build your position. As the Reddit fire burns brighter and Bitcoin momentum returns, MSTR is poised to lead the next charge toward new highs. Maintain discipline and let the system handle the exit.
🔗 Related Analysis in US Stock Portfolio:
Arm Holdings (ARM) Chart Analysis: The Architect of the On-Device AI Era (2026.04.24)
* Disclaimer: This post is based on market conditions as of April 24, 2026, and is strictly for educational and chart analysis purposes. It is not financial advice. Please do your own research (DYOR).
* Data Source: TradingView / Nasdaq