Explore More US Stock Portfolio Analyses →
This Costco chart analysis reveals the textbook turnaround of the ultimate consumer staples mega-cap, offering a safe harbor in a sea of tech volatility. Explorer StockArgo. Welcome as we cut through the market noise to navigate the deep currents of systemic algorithms and institutional capital.
“Neither inflation nor market panic can breach the fortress of Costco’s membership power.” While tech stocks experience wild swings, Costco wholesale has completed a healthy short-term consolidation and is gathering energy for its next ascent.
Our designated target for the US Stock Portfolio today is Costco Wholesale (Ticker: COST). On the daily (1D) chart, we are observing an incredibly stable and high-probability entry point. While the broader market was gripped by fear from recent tech sell-offs, Costco utilized this period for a mechanical cool-down. Let’s dissect this perfect “buy the dip” setup using our three core system indicators.
⏱️ 3-Second Executive Summary (Daily Analysis)
| System Core Indicator | Analysis Status (Fact Check) | StockArgo Strategy |
|---|---|---|
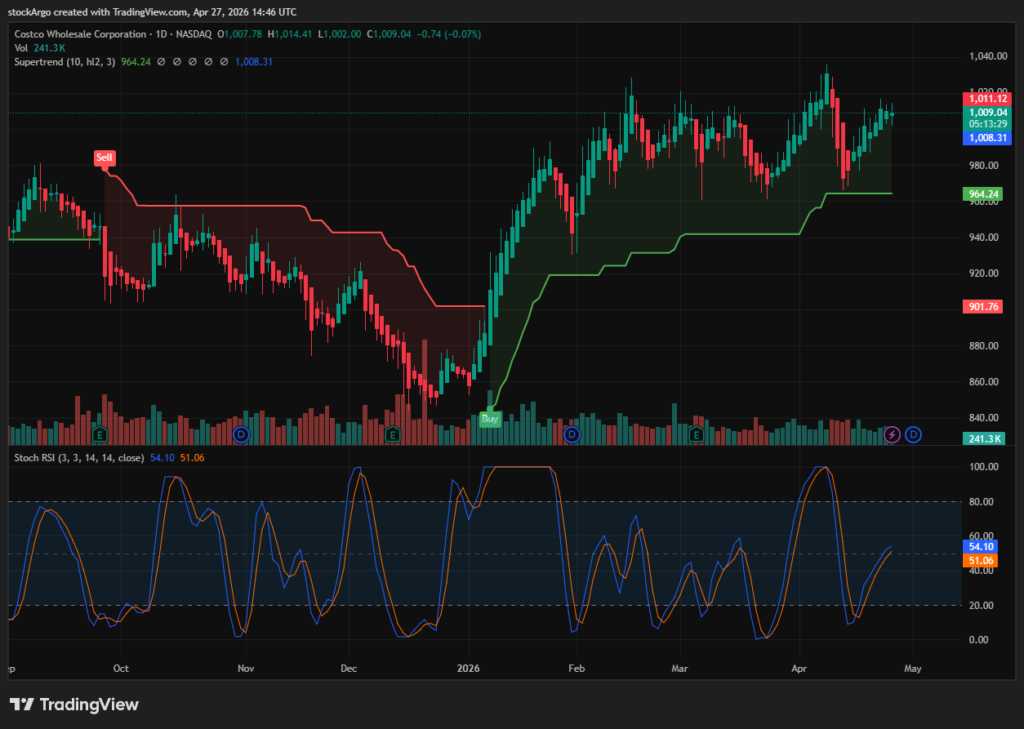
| Stoch RSI (Daily 1D / 3, 3, 14, 14) | Currently at 53.91 / 50.99. Escaping the oversold floor, a clear Golden Cross has formed as the K-line slices upward through the D-line. | 🟢 Strong Buy Signal |
| Heikin Ashi (Daily 1D / Standard) | The tedious red corrective wave has halted, replaced by green bullish candles confirming the trend reversal. | 🔵 Trend Reversal Confirmed |
| SuperTrend (Daily 1D / 10, hl2, 3) | A massive Green (Buy) support line is firmly established at $964.24, acting as an unbreakable floor. | 💎 Stable Swing Entry |
🚀 Strategic Conclusion: This is a textbook turnaround for a mega-cap stock. The Stochastic RSI has fired a golden cross from the bottom, and Heikin Ashi has flipped green. With the $964 SuperTrend acting as a definitive stop-loss, this is the optimal zone to accumulate shares for a comfortable ride back to all-time highs.
📰 Fundamentals: The Impenetrable Moat of Membership Loyalty
Before executing any trades based on our Costco chart analysis, we must appreciate the structural fundamentals that make this stock the ultimate defensive powerhouse.
Costco is not a traditional retailer. As detailed on the Costco Investor Relations site, the vast majority of their operating income is generated not from retail margins, but from membership fees. With a global renewal rate consistently above 90%, Costco essentially guarantees a massive, predictable stream of cash flow every single month. Whether interest rates spike or economic growth slows, consumers will not easily cancel their Costco memberships. This fundamental resilience is exactly why institutional investors rush to buy the dip, defending the SuperTrend support lines with unwavering conviction.
🧭 Technical Costco chart analysis: The Energy-Packed Golden Cross
With an understanding of its impregnable fundamentals, we now turn to our mechanical system to pinpoint the exact entry. The daily chart is currently presenting a hunter’s dream scenario.
1. Stochastic RSI: The Bottom Escape and Golden Cross
[System Setting: Daily 1D / 3, 3, 14, 14]
This is the centerpiece of today’s Costco chart analysis. After thoroughly cooling off its overbought status and scraping the bottom, the Stochastic RSI has rebounded to 53.91 / 50.99. A decisive golden cross has occurred, with the blue K-line driving up through the orange D-line. This is a purely mechanical signal indicating that the selling pressure is exhausted and a new upward wave is taking control.
2. Heikin Ashi: The Return of the Green Momentum
[System Setting: Daily 1D / Standard]
Heikin Ashi candles are exceptional at filtering out market noise. The recent sequence of red, bearish corrective candles has finally ended. We are now seeing the emergence of green bullish candles, visually confirming that the price action has pivoted from downward consolidation back to the macro uptrend.
3. SuperTrend: The $964.24 Iron Shield
[System Setting: Daily 1D / 10, hl2, 3]
This is our ultimate safety net. Below the current price of $1,008, a formidable Green (Buy) SuperTrend support is laid out at $964.24. Notice how Costco’s price action consistently respects this line during pullbacks, utilizing it as a springboard. As long as this $964 line remains unbroken, the macro bullish thesis remains absolutely intact.
💡 StockArgo’s Strategy: A Peaceful Trade for Busy Lives
“Do not let the flashing numbers on a screen consume your day. Secure a fortress like Costco at a systematic golden cross, and focus on your real life.”
To conclude, our Costco chart analysis confirms a highly reliable, low-stress entry point. Unlike the wild swings of tech mid-caps, Costco offers peaceful stability. The Stoch RSI golden cross crossing the 50 mid-line is a robust signal. Establish your position here, set your trailing stop just below the $964.24 SuperTrend line, and let the sheer power of global consumer staples do the heavy lifting for your portfolio.
🔗 Related Analysis in US Stock Portfolio:
Palantir (PLTR) Chart Analysis: Healthy Consolidation for the B2B AI Leader (2026.04.27)
* Disclaimer: This post is based on market conditions as of April 27, 2026, and is strictly for educational and chart analysis purposes. It is not financial advice. Please do your own research (DYOR).
* Data Source: TradingView / Nasdaq