Explore More US Stock Portfolio Analyses →
This Astera Labs chart analysis dissects the explosive 4-hour (4H) trend breakout and the massive capital inflows driving the core infrastructure of AI data centers. Explorer StockArgo. Welcome aboard as we cut through the market noise to navigate the deep currents of systemic algorithms and global liquidity.
“No matter how powerful Nvidia’s GPUs are, they are useless if data cannot travel between chips seamlessly.” Astera Labs, the undisputed king of connectivity technology resolving the massive bottlenecks in AI infrastructure, is shattering previous resistance levels and creating a breathtaking upward wave.
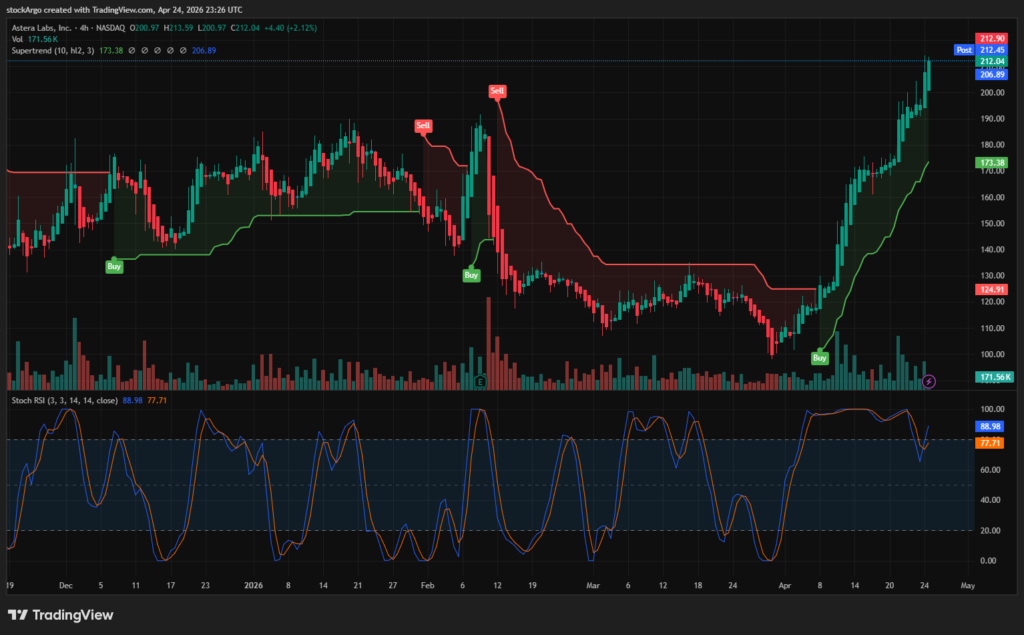
Our designated target for today’s US Stock Portfolio is Astera Labs (Ticker: ALAB). Closing at a striking $212.04, the stock has painted a phenomenal trajectory on the chart. Escaping the tedious swamp of its recent downtrend and consolidation, the 4-hour (4H) chart is now erupting with buying energy, pushing the price near-vertical. Through our three core system indicators forming the backbone of this massive rally, we will thoroughly analyze the intensity of the current momentum and our tactical response.
⏱️ 3-Second Executive Summary (4H Setup)
| System Core Indicator | Analysis Status (Fact Check) | StockArgo Strategy |
|---|---|---|
| Stoch RSI (4H / 3, 3, 14, 14) | Currently at 88.98 / 77.71. The K-line has crossed above the D-line while in the overbought territory (>80), forming a powerful re-acceleration golden cross. | 🔥 Explosive Momentum |
| Heikin Ashi (4H / Standard) | Breaking the previous high near $206.89, consecutive wickless green candles are skyrocketing upwards. | 🟢 Total Buyer Dominance |
| SuperTrend (4H / 10, hl2, 3) | A firm Green (Buy) support line is steeply rising at $173.38, catching the explosive trend from below. | 🔵 Hold & Watch the Gap |
🚀 Strategic Conclusion: This is a flawless breakout wave. ALAB has digested all previous bearish waves and successfully conquered the $200 high ground. Since the momentum is at its absolute peak, attempting a premature short position is suicidal. Current holders should ride this upward wave to the fullest, but be mindful of the widening gap from the SuperTrend by utilizing a trailing stop-loss strategy.
📰 Fundamentals: Paving the Highway for Global AI Infrastructure
Before relying on our technical Astera Labs chart analysis, we must comprehend the macroeconomic fundamentals driving this ticker to ascend at such a terrifying angle.
According to the official Astera Labs investor relations and global semiconductor trend reports, as the scale of AI clusters expands exponentially, data transmission bottlenecks have emerged as the most critical challenge. Astera Labs holds overwhelming technological supremacy in PCIe retimers and CXL memory controllers. They supply the absolute core hardware necessary for building AI servers for Big Tech giants, primarily Nvidia. Along with Marvell Technology (MRVL) in the silicon photonics space, Astera Labs enjoys a monopolistic status in constructing the “high-speed highways” of AI infrastructure, sucking in massive global capital like a black hole.
🧭 Technical Astera Labs chart analysis: The Madness of the 4H Rally
A stock exploding with solid fundamental backing defies amateur predictions. Only strict adherence to system indicators can accurately capture the entry and exit points in such a volatile environment.
1. Heikin Ashi: The Relentless Bullish Surge
[System Setting: 4-hour 4H / Standard]
Observe the shape of the candles dominating the chart. After establishing a solid bottom around the $120 mark, the price is now surging past $212 with consecutive wickless green candles. This is visual proof that institutional-level buying power is absorbing all minor intraday noise and selling pressure, dictating a one-sided trend. It perfectly shattered the previous major resistance at $206.89 on a closing basis.
2. Stochastic RSI: Re-igniting the Overbought Engine
[System Setting: 4-hour 4H / 3, 3, 14, 14]
The most astonishing aspect is the momentum indicator. Despite the sustained rally pushing the Stochastic RSI deep into the overbought zone, the current reading sits at 88.98 / 77.71. The K-line has aggressively crossed above the D-line, creating a re-acceleration golden cross. In a normal market, this would be a zone for cooling down. However, leading stocks riding a supercycle often stick their indicators to the ceiling (80-100) while violently pumping the price—a classic “ceiling rally.”
3. SuperTrend: The Location of the Safety Belt
[System Setting: 4-hour 4H / 10, hl2, 3]
Currently, a Green (Buy) support line is stepping upwards at $173.38, securing the rear. While the macro uptrend is undeniable, we must acknowledge the significantly widening gap (disparity rate) between the current price ($212) and the support line ($173). For hunters looking for a new entry, diving into the center of this madness is not advised. The textbook approach is to wait patiently for a technical pullback toward the $190s or the $173 SuperTrend support as the Heikin Ashi candle bodies begin to shrink.
💡 StockArgo’s Strategy: Ride the Trend, Raise the Shield
“Previous resistance ($206.89) has now become the new support. Do not dismount a galloping horse prematurely; maximize your profits until the system signals a stop.”
The conclusion of our Astera Labs chart analysis is straightforward: this is a tremendous explosive force befitting the leading stock of AI data center connectivity. Closing at $212.04, it stands at the absolute peak of a perfect trend. Holders should enjoy this rally until the Stochastic RSI hits 100, forms a death cross, and red Heikin Ashi candles appear. However, as the first rule of navigation dictates, always protect your hard-earned profits by setting a mechanical trailing stop-loss at the $200 round figure or the $173 SuperTrend line.
🔗 Related Analysis in US Stock Portfolio:
MicroStrategy (MSTR) Chart Analysis: Hunting the Absolute Bottom (2026.04.24)
* Disclaimer: This post is based on market conditions at the close on April 24, 2026, and is strictly for educational and chart analysis purposes. It is not financial advice. Please do your own research (DYOR).
* Data Source: TradingView / Nasdaq