Explore More US Stock Portfolio Analyses →
This AST SpaceMobile chart analysis dissects the daily (1D) momentum of ASTS, the wild stallion of space communication where market madness and extreme fear perfectly intersect. Explorer StockArgo. Welcome aboard as we cut through the retail noise to navigate the deep currents of institutional capital and systemic algorithms.
“When the retail crowd panics and hits the sell button, a system trader’s sniper scope zeroes in on the abyss of oversold territory.” Having once broken past $130, the price has collapsed back into the $70s. Is this an ongoing crisis, or the entry point of a lifetime?
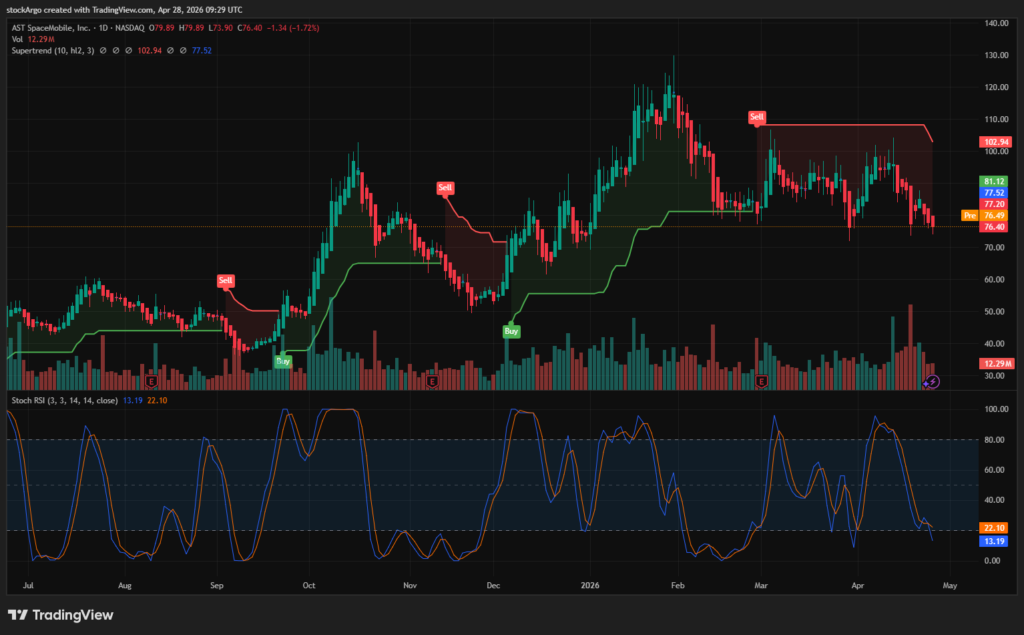
Our focus for the US Stock Portfolio today is AST SpaceMobile (Ticker: ASTS). On the daily (1D) chart, we are observing a highly strategic and brutal pullback phase. Following a euphoric rally, the chart is currently undergoing a mechanical capitulation driven by the exit of speculative FOMO capital. For a successful AST SpaceMobile chart analysis, we must ignore the panic and mechanically pinpoint the exact zone where rebound energy is accumulating. Let’s dissect the fierce battle between buyers and sellers near the $76 defense line using our three core system indicators.
⏱️ 3-Second Executive Summary for Busy Captains: AST SpaceMobile chart analysis
| System Core Indicator (Timeframe & Settings) | Analysis Status (Fact Check) | StockArgo Strategy |
|---|---|---|
| Stoch RSI (Daily 1D / 3, 3, 14, 14) | Currently at 13.19 / 22.10. Plummeting below the 20 oversold threshold, indicating severe selling exhaustion. | 🔵 Prepare Split Buys Near $76 Dip |
| Heikin Ashi (Daily 1D / Standard) | Following a long bullish rally, red bearish candles with lower wicks have appeared, signaling an ongoing brutal correction. | 🔴 Avoid Premature Chasing |
| SuperTrend (Daily 1D / 10, hl2, 3) | The previous support broke, and a massive Red (Sell) resistance ceiling is now suppressing the price at $102.94. | 💎 Short-term Trend Risk Management Essential |
Fundamental Collapse or Peak Capitulation?
When analyzing a falling knife, the first step is fact-checking. Reviewing the latest Yahoo Finance ASTS data and space industry reports confirms that the commercial deployment schedule of ASTS’s Direct-to-Device technology remains firmly on track. Partnerships with global telecom giants are solid. Therefore, the current price drop is not a collapse of fundamentals, but a domino effect of stop-losses triggered by speculative capital that blindly bought at the top. Understanding this psychology is the most critical first step of our AST SpaceMobile chart analysis.
This irrational plunge is mechanically documented on our 1D Heikin Ashi chart as a ruthless red wave. Even more painful is that our previous Supertrend support line has been decisively broken, transforming into an impenetrable Red (Sell) resistance wall at $102.94. In the short term, smashing through this massive ceiling without an extraordinary catalyst is virtually impossible.
Stoch RSI 13.19: The Mechanical Reason to Buy the Fear
When the crowd despairs over broken support lines, one indicator makes a system trader’s heart beat faster: the Stochastic RSI. Look closely at the bottom of the chart. The indicator, which once pumped madness near the 100 mark, has plummeted vertically to an absolute oversold reading of 13.19. With the blue K-line writhing beneath the orange D-line, it mechanically proves that “those who intended to sell in panic have already sold.”
The price is currently hovering around $79, with a fierce battle unfolding to defend the critical $76.40 structural support line. Now is not the time to blindly execute market orders. Discipline is paramount. Wait for the red Heikin Ashi candles to lose their lower wicks and for the first green bullish candle to appear. That is the mechanical signal that smart money has taken the steering wheel again. Prepare your split-buying nets near the $76 mark and wait for the golden cross. When the massive short squeeze detonates, the thrill of profit belongs solely to those who read this AST SpaceMobile chart analysis to the end and trusted the system.
🔗 Related Analysis in US Stock Portfolio:
* Disclaimer: This post is based on market conditions as of April 28, 2026, and is strictly for educational and chart analysis purposes. It is not financial advice. Please do your own research (DYOR).
* Data Source: TradingView / Yahoo Finance