Explore More US Stock Portfolio Analyses →
This Applied Optoelectronics chart analysis dissects the daily (1D) momentum of AAOI, a leading player in the optical transceiver market essential for the expansion of AI infrastructure. Explorer StockArgo. Welcome as we cut through the market noise to navigate the deep currents of systemic algorithms and institutional liquidity.
“No matter how fast the AI computation is, it is useless if the highway (Optical Connectivity) is congested.” As demand for 800G optical modules in data centers explodes, AAOI has positioned itself as an indispensable driver of the AI rally beyond simple hardware manufacturing.
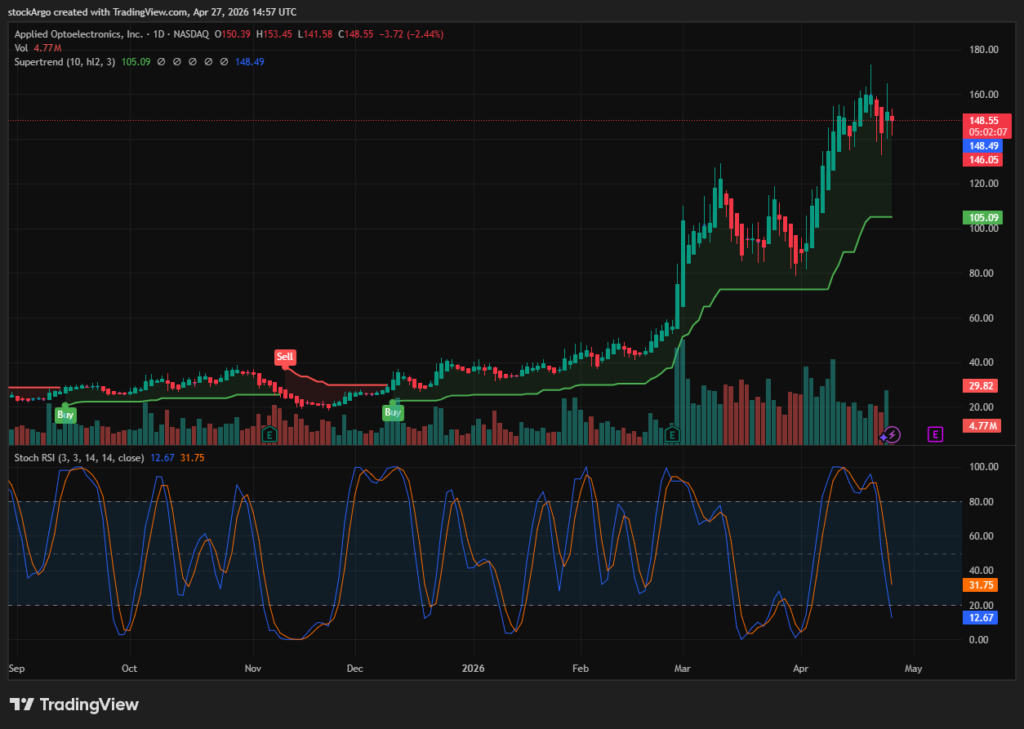
Our focus for the US Stock Portfolio today is Applied Optoelectronics (Ticker: AAOI). On the daily (1D) chart, we are observing a highly strategic pullback phase. Following several months of explosive growth, the chart is currently undergoing a mechanical cooling process to consolidate energy. Our system indicators have begun hitting “the floor,” presenting a surgical sniping opportunity for patient hunters. Let’s dissect the fierce battle between buyers and sellers near the $148 level using our three core system indicators.
⏱️ 3-Second Executive Summary (Daily Analysis)
| System Core Indicator | Analysis Status (Fact Check) | StockArgo Strategy |
|---|---|---|
| Stoch RSI (Daily 1D / 3, 3, 14, 14) | Currently at 12.67 / 31.75. Plummeting below the 20 oversold threshold, indicating that selling pressure has reached rock bottom. | 🔵 Await Oversold Snipe |
| Heikin Ashi (Daily 1D / Standard) | Following a long bullish rally, red bearish candles have appeared, signaling an ongoing short-term price correction. | 🔴 Avoid Premature Chasing |
| SuperTrend (Daily 1D / 10, hl2, 3) | A Green (Buy) support line is established at $105.09, though there is a significant gap between the current price and this support. | 💎 Entry after Support Check |
🚀 Strategic Conclusion: This is a classic “blood in the streets” correction for a high-momentum stock. With the Stochastic RSI hitting a remarkable low of 12.67, the justification for a rebound is substantial. However, discipline is required; wait for the Heikin Ashi candles to flip from red to green before initiating the hunt.
📰 Fundamentals: Leading the 800G Era of AI Data Center Connectivity
Successful Applied Optoelectronics chart analysis requires an understanding of the company’s technological moat. AAOI is not just a cable company; it is a critical player in the optical transceiver sector, which uses light to transmit data at lightning speeds.
According to the official Applied Optoelectronics website and recent semiconductor supply chain reports, Big Tech giants like Microsoft are transitioning from 400G to 800G optical infrastructure. This shift is causing an exponential surge in demand for AAOI’s high-performance optical products. Even if AI servers compute data rapidly, the entire system stalls if the optical modules fail to deliver that data. This powerful tailwind provides strong downward rigidity, ensuring the long-term macro uptrend remains intact despite short-term pullbacks.
🧭 Technical Applied Optoelectronics chart analysis: Opportunities at the Oversold Floor
The real opportunity arises when blood flows where madness once reigned. Our system indicators are currently sending a very clear “prepare” signal on the AAOI chart.
1. Stochastic RSI: Exhaustion of Selling Energy
[System Setting: Daily 1D / 3, 3, 14, 14]
This is the primary clue in today’s Applied Optoelectronics chart analysis. The indicator, which previously rode the 100.00 ceiling, has plunged to an absolute oversold reading of 12.67. This is a mechanical signal that market fear is at its peak and those who intended to sell have likely already done so. The moment the blue K-line turns upward to cross the orange D-line, the suppressed buying energy will erupt.
2. Heikin Ashi: Wait for the End of the Red Wave
[System Setting: Daily 1D / Standard]
The Heikin Ashi candles are still printing red, indicating that the momentum of the trend is still downward. Even if the Stochastic RSI is at the floor, do not reach out until the candle color flips to green. The appearance of the first green candle will be the official signal to open all ports for the hunt.
3. SuperTrend: The Gap Between $105 and $148
[System Setting: Daily 1D / 10, hl2, 3]
While the current price is around $148, the Green (Buy) SuperTrend support is located at $105.09. This significant gap presents both a risk of a deeper correction toward the support and the potential for a mid-air rebound due to strong momentum. Therefore, a smart strategy involves building a position through split entries rather than a single large purchase, focusing on confirmation signals.
💡 StockArgo’s Strategy: Patience Tames the Wild Stallion
“While everyone was cheering the explosion of AAOI, we sold. Now, while everyone sells in fear, we smile at the 12.67 systemic indicator.”
In conclusion, our Applied Optoelectronics chart analysis confirms that AAOI’s growth is undeniable. The current price correction is a necessary cooling process for the engine before it targets new all-time highs. Trust the low 12.67 RSI reading and focus solely on the Heikin Ashi color change. The moment the system shouts “GO,” we will once again lead the charge in this massive optical connectivity rally.
🔗 Related Analysis in US Stock Portfolio:
Costco (COST) Chart Analysis: The Ultimate Mega-Cap Turnaround (2026.04.27)
* Disclaimer: This post is based on market conditions as of April 27, 2026, and is strictly for educational and chart analysis purposes. It is not financial advice. Please do your own research (DYOR).
* Data Source: TradingView / Nasdaq