Explore More US Stock Portfolio Analyses →
This Ecolab chart analysis reveals the daily (1D) momentum and systemic entry points for ECL, the undisputed global leader in the ‘water cooling’ market—the hidden Achilles’ heel of AI infrastructure expansion. Welcome aboard as we cut through the market noise to navigate the deep currents of institutional capital and the precise turnaround signals indicated by systemic algorithms.
“When everyone swings their pickaxes to find gold (AI chips), the one who sells the water (cooling solutions) at the highest price becomes the ultimate victor.” Amidst the AI valuation debate, Ecolab’s water treatment infrastructure boasts an immovable monopolistic demand driven by data center thermal management.
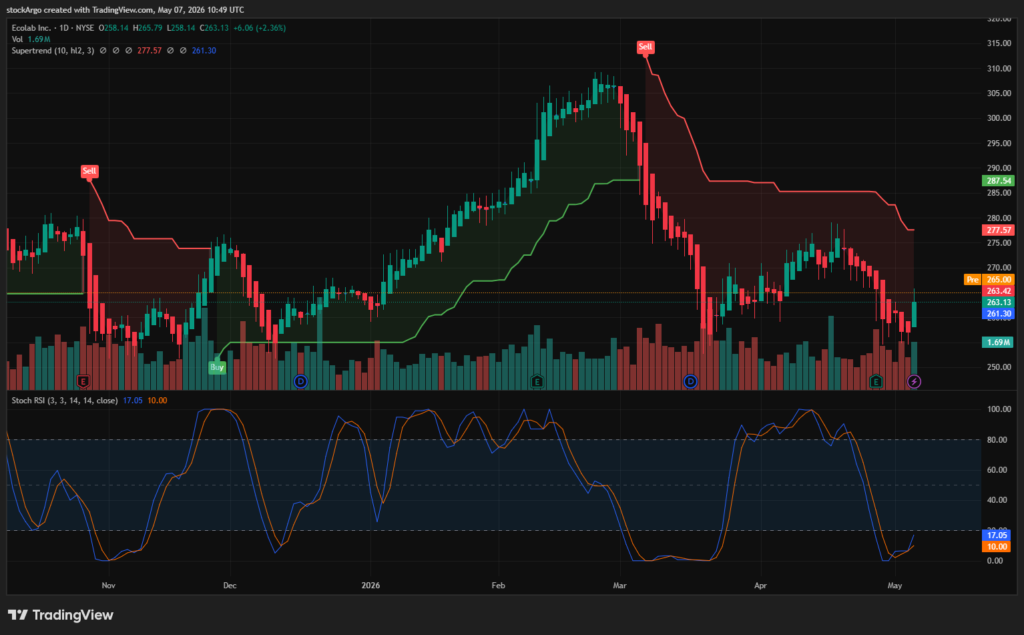
Our designated target for the [US Stock Portfolio] today is Ecolab (Ticker: ECL). On the daily (1D) chart, ECL has entered a picture-perfect V-shaped turnaround phase that makes a hunter’s heart race. While the broader tech sector underwent a correction, this fundamental infrastructure giant hit a mechanical oversold floor and immediately attracted strong buying interest. Crucially, our core system indicators have confirmed a highly reliable ‘bottom golden cross,’ signaling a surgical sniping opportunity for patient swing traders. Let’s dissect the inception of this rebound near the $263 level using our three core system indicators.
⏱️ 3-Second Executive Summary (1D Analysis)
| System Core Indicator | Analysis Status (Fact Check) | StockArgo Strategy |
|---|---|---|
| Stoch RSI (Daily 1D / 3, 3, 14, 14) | Currently at 17.05 / 10.00. A perfect golden cross has formed within the extreme oversold zone (below 20) as the K-line pierces above the D-line. | 🟢 Active Swing Buy Signal |
| Heikin Ashi (Daily 1D / Standard) | The red downward wave from the peak has halted, replaced by a green bullish candle radiating strong rebound energy. | 🔵 Trend Reversal Confirmed |
| SuperTrend (Daily 1D / 10, hl2, 3) | A Red (Sell) resistance line sits at $277.57, leaving a wide ‘gap’ for upward momentum compared to the current price of $263. | 💎 Target $277 Swing Entry |
🚀 Strategic Conclusion: This is the perfect ‘buying sweet spot’ where stellar AI infrastructure fundamentals meet an oversold floor. The Stochastic RSI has fired a clear golden cross at 17.05, marking the end of the drop. With the path clear up to the $277.57 resistance, it is time to trust the green turnaround candle and cast the nets wide.
📰 Fundamentals: Monopolizing Water Cooling Beyond Semiconductor Hype
A successful Ecolab chart analysis requires understanding why smart money is rotating from chip makers into this water treatment giant. To avoid short-term noise, we must look at the essential utility.
According to the latest Yahoo Finance ECL data and global environmental reports, ‘Water Stress’ caused by AI data center operations has emerged as a major social and regulatory challenge. Tech giants like Microsoft and Google are essentially forced to rely on Ecolab’s chemical water treatment solutions to purify and recycle cooling water. Regardless of GPU valuation debates or semiconductor cycle peaks, the demand for Vertiv’s cooling fans and Ecolab’s water management explodes as long as AI grows. This provides a perfect fundamental hedge against tech volatility.
🧭 Technical Ecolab chart analysis: The Perfect Golden Cross at 17.05
When high-quality blue chips are dumped due to market noise, it is hunting season for institutional capital. Our system indicators are currently flashing an “aggressive buy” signal on the ECL chart.
1. Stoch RSI: The Golden Cross Fed by Fear (17.05)
[System Setting: Daily 1D / 3, 3, 14, 14]
This is the primary buying rationale in today’s Ecolab chart analysis. Look closely at the bottom indicator. The line, which plummeted vertically during the correction, has finally hit the brakes in the extreme oversold zone (below 20). Currently recording 17.05 / 10.00, the blue K-line has forcefully pierced above the orange D-line from the floor. This provides mechanical proof that short-term selling pressure has been fully absorbed, and institutional buying energy is beginning to lift the chart.
2. Heikin Ashi: The Flare of Rebound, Appearance of Green
[System Setting: Daily 1D / Standard]
What elevates the reliability of a golden cross is the candle color change. The tedious red bearish wave that started near the $280s has finally ceased, replaced by a green bullish candle radiating upward momentum. This candle, pushing upwards with a lower wick, signifies that the downward inertia has been completely flipped (Turnaround).
3. SuperTrend: A Highway Open to the $277.57 Resistance
[System Setting: Daily 1D / 10, hl2, 3]
The price has successfully rebounded to the $263.13 level. Looking overhead, the massive Red (Sell) SuperTrend resistance line sits at $277.57. This means there is a wide ‘gap’ of empty space with no immediate obstacles until the price hits that ceiling. Despite the gap from the lower support, the momentum of this oversold turnaround is powerful enough to offer a highly attractive risk-reward ratio for a swing rally toward $277.
💡 StockArgo Insight: Do Not Fear the Inception of a Turnaround
“The real gold mine of the AI market lies in the invisible water. Only those who pick it up when the indicator fires a golden cross at the 17s will monopolize the benefits of the supercycle.”
The conclusion of today’s Ecolab chart analysis is clear. Ecolab’s mid-to-long-term fundamentals, solving the AI Achilles’ heel, make it the safest alternative. The current chart position is a flawless turnaround spot where whales have retaken the steering wheel after an excessive correction. Trust the combination of the 17.05 Stochastic golden cross and the green Heikin Ashi candle. Raise your anchor and target the $277 resistance as your first take-profit zone. The ‘GO’ signal from the system will lead you down the safest path to profit.
🔗 Related Analysis in US Stock Portfolio:
* Disclaimer: This post is based on market conditions as of May 07, 2026, and is strictly for educational and chart analysis purposes. It is not financial advice. Please do your own research (DYOR).
* Data Source: TradingView / Yahoo Finance