Explore More US Stock Portfolio Analyses →
This Occidental Petroleum chart analysis dissects the daily (1D) momentum and ruthless risk management entry points for OXY, Warren Buffett’s favored energy mega-cap, amidst sticky inflation and geopolitical risks. Welcome aboard as we cut through the market noise to navigate the deep currents of institutional capital and the precise short-term top signals indicated by systemic algorithms.
“At the end of a massive rebound wave, a steep cliff of resistance always awaits. Now is not the time for greed, but to secure profits and hold cash.” Even if it is a company beloved by Warren Buffett, when mechanical indicators warn of severe overheating, a true system trader’s ironclad rule is to take a step back and avoid the impending storm.
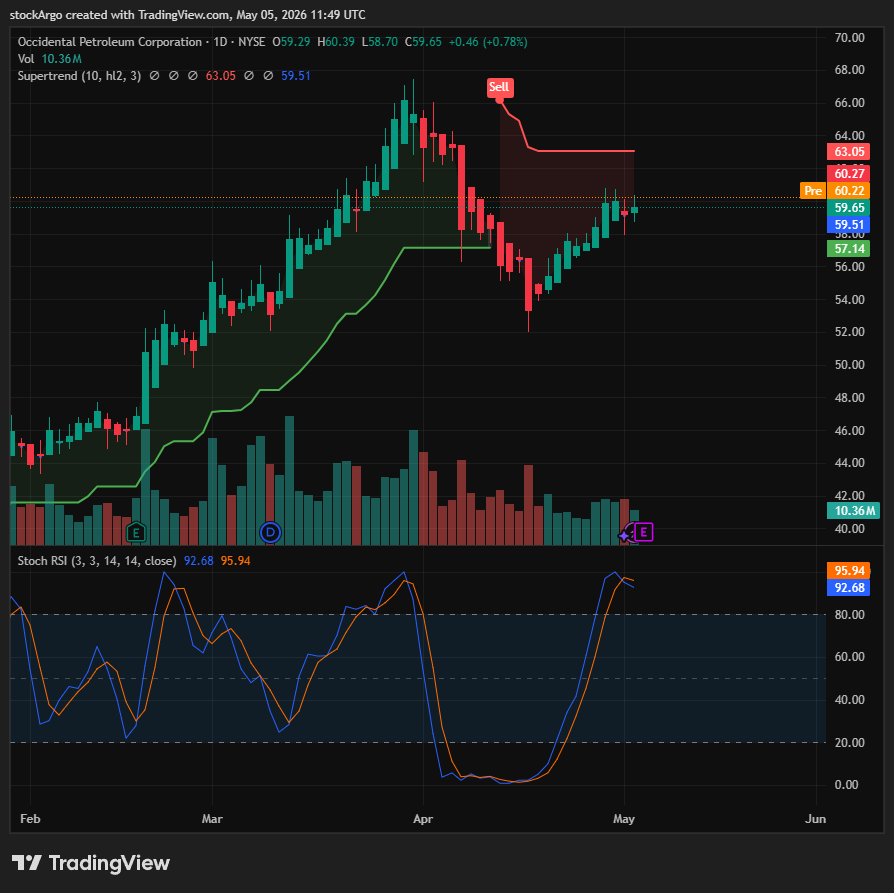
Our designated target for the [US Stock Portfolio] today is Occidental Petroleum (Ticker: OXY). On the daily (1D) chart, OXY has entered a textbook short-term overbought phase that strongly dictates a ‘wait-and-see’ approach for hunters. After carving a bottom near $52, the stock rebounded sharply to reclaim the $59 level. However, the chart is currently on the verge of slamming its head against a thick red resistance line, and its upward energy is rapidly depleting. Crucially, our core system indicator has fired a definitive ‘death cross,’ signaling lethal risk for those who chase the rally prematurely. Let’s dissect the mounting selling pressure around the $60 level using our three core system indicators.
⏱️ 3-Second Executive Summary (1D Analysis)
| System Core Indicator | Analysis Status (Fact Check) | StockArgo Strategy |
|---|---|---|
| Stoch RSI (Daily 1D / 3, 3, 14, 14) | Currently at 92.68 / 95.94. A clear death cross has occurred as the blue K-line breaks downwards through the orange D-line deep within the overbought zone (above 80). | 🔴 Strictly Prohibit New Entries |
| Heikin Ashi (Daily 1D / Standard) | The green bullish wave that surged from the bottom continues, but its upward elasticity is visibly stalling as it approaches the resistance ceiling. | ⚡ Consider Scaling Out (Take Profit) |
| SuperTrend (Daily 1D / 10, hl2, 3) | A massive Red (Sell) resistance line has formed above the price at $63.05, acting as an iron ceiling preparing to suppress the stock. | 💎 Wait on Sidelines Until Breakout |
🚀 Strategic Conclusion: This is a classic “profit-taking anticipation” phase where a strong short-term rebound is about to hit a massive wall of resistance. With the Stochastic RSI bending into a death cross at an extreme 92.68, downward pressure will intensify. Now is not the time to discuss buying the dip; it is the exact moment to stay warm on the sidelines until the indicator cools down and hits the oversold floor (below 20) once again.
(Captain! Replace this placeholder with your actual OXY daily chart. Do not change the alt text.)
📰 Fundamentals: An Excellent Moat Validated by Buffett, but Short-Term Price is Another Story
For successful trading, one must objectively see the chart’s true face hidden behind bullish news. Looking at the latest Yahoo Finance OXY data and macroeconomic indicators, Occidental Petroleum’s mid-to-long-term fundamentals are exceptionally strong.
Massive shale oil reserves in the Permian Basin and Warren Buffett’s (Berkshire Hathaway) continuous stake accumulation are the most reliable tailwinds supporting this company’s backbone. When geopolitical crises erupt in the Middle East or a high-interest-rate environment persists, market capital naturally flocks to safe energy assets. However, the problem lies in the “mechanical price positioning right now.” No matter how great a stock is, when it rebounds sharply in a short period and technical indicators become overheated, selling pressure inevitably pours in, causing the price to slide. This is why we must strictly eliminate emotion and analyze the chart mechanically.
🧭 Technical Occidental Petroleum chart analysis: An Overheated Engine and the $63 Resistance
The euphoria of the V-shaped rebound from the bottom is ending, and the dark shadow of selling pressure is looming. Our system indicators are currently sending a very clear “danger warning signal” on the OXY chart.
1. Stoch RSI: Exhaustion of Rebound Energy and Death Cross (92.68)
[System Setting: Daily 1D / 3, 3, 14, 14]
This is the most critical clue in today’s Occidental Petroleum chart analysis and the strongest rationale for prohibiting buys. Look closely at the bottom indicator. The line that skyrocketed vertically from the floor has shot well past the overbought threshold (80). Unable to push higher, it is currently recording 92.68 / 95.94, with the blue line bending sharply downward. A definitive ‘death cross’ has occurred as the K-line slices down through the D-line. This is the system’s ruthless warning that buying energy is completely exhausted and the price has a high probability of cascading downward following the indicator.
2. SuperTrend: The Ruthless Pressure of the $63.05 Resistance
[System Setting: Daily 1D / 10, hl2, 3]
The current price has successfully rebounded and is hovering around the $59.65 mark. However, looking up just above its head, a massive Red (Sell) SuperTrend resistance line sits heavily at $63.05. Even if the recent rally continues, breaking through this iron-clad resistance in a single stroke is nearly impossible. Whales are highly likely to offload their holdings and take profits near this thick ceiling, potentially subjecting the price to a deep correction back down to previous support zones.
3. Heikin Ashi: The Accumulation of Upward Fatigue
[System Setting: Daily 1D / Standard]
The current candle chart paints green bullish candles, seemingly indicating an upward trend on the surface. However, when combined with the Stochastic death cross below and the $63 resistance above, these green candles are on the verge of losing their thrust and flipping into red bearish candles. Pressing the buy button now, shouting “let’s jump on the running horse,” simply means you will be absorbing institutional offload at the absolute top.
💡 StockArgo Insight: A Hunter Does Not Run Toward a Cliff
“Even if it’s Warren Buffett’s sturdy shield, if the indicator fires a death cross at the 92 level, you must put the shield down, step back, and dodge the downpour of profit-taking.”
The conclusion of today’s Occidental Petroleum chart analysis is clear. The long-term fundamentals of OXY, backed by Warren Buffett, are superior to almost any other asset. However, the current chart position is where a ruthless institutional profit-taking is imminent to cool down an overheated engine. Trust the Stochastic 92.68 death cross reading, and observe from the sidelines until the green candles turn red and the downward wave completely concludes. The moment the system shouts ‘GO’ again from the oversold Stochastic floor (below 20), we will drop our anchor alongside Buffett from the safest possible position.
🔗 Related Analysis in US Stock Portfolio:
* Disclaimer: This post is based on market conditions as of May 05, 2026, and is strictly for educational and chart analysis purposes. It is not financial advice. Please do your own research (DYOR).
* Data Source: TradingView / Yahoo Finance