Explore More US Stock Portfolio Analyses →
This Southern Copper chart analysis dissects the daily (1D) momentum and systemic entry points for SCCO, the undisputed leader in the copper mining market and the critical artery of the AI power grid expansion. Welcome aboard as we cut through the retail noise to navigate the deep currents of institutional capital and systemic algorithms.
“If you want to build data centers and draw power, every wire in the world ultimately leads to copper.” With an explosive surge in copper demand driven by global power grid upgrades and AI infrastructure expansion, Southern Copper has evolved from a simple mining company into the essential engine of the 4th Industrial Rally.
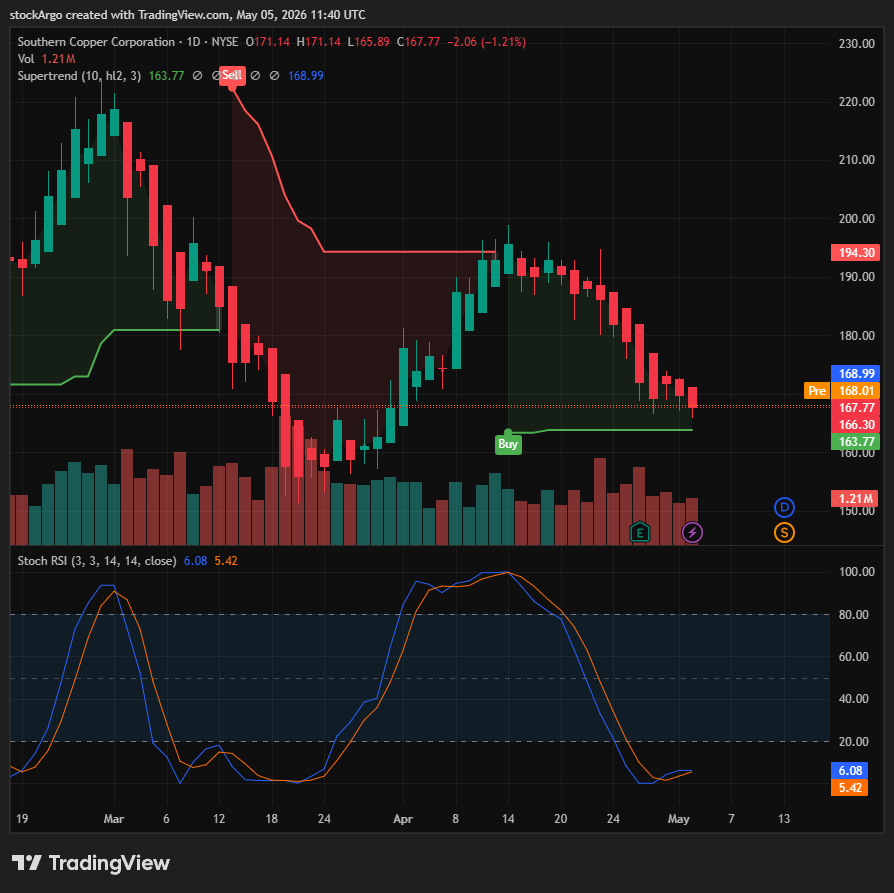
Our designated target for the [US Stock Portfolio] today is Southern Copper (Ticker: SCCO). On the daily (1D) chart, SCCO has entered a highly strategic and tense support defense phase. Amidst short-term price corrections caused by raw material market volatility, the chart is currently engaged in a fierce tug-of-war right above the SuperTrend green support line. Crucially, one of our core system indicators is preparing for a turnaround from the “oversold floor,” signaling an attractive sniping opportunity for patient hunters. Let’s dissect the battle between buyers and sellers near the $167 level using our three core system indicators.
⏱️ 3-Second Executive Summary (1D Analysis)
| System Core Indicator | Analysis Status (Fact Check) | StockArgo Strategy |
|---|---|---|
| Stoch RSI (Daily 1D / 3, 3, 14, 14) | Currently at 6.08 / 5.42. An initial golden cross formation is captured as the K-line pierces above the D-line within the extreme oversold zone (below 20). | 🔵 Await Oversold Snipe |
| Heikin Ashi (Daily 1D / Standard) | Red bearish candles indicating a tedious downward correction persist, with no green trend reversal candles yet visible. | 🔴 Avoid Premature Chasing |
| SuperTrend (Daily 1D / 10, hl2, 3) | A formidable Green (Buy) support line acts as a carpet just below the current price at $163.77, robustly defending against downside risk. | 💎 Enter Based on $163 Support |
🚀 Strategic Conclusion: This is a textbook “support defense battle” phase seen in a copper supercycle leader. The Stochastic RSI has raised its head from an extreme floor of 6.08, providing the mechanical justification for a rebound. Set the $163.77 SuperTrend support line as a strict stop-loss (risk management) and prepare for the hunt when the turnaround signal—the halt of Heikin Ashi red candles—is confirmed.
(Captain! Replace this placeholder with your actual SCCO daily chart. Do not change the alt text.)
📰 Fundamentals: The Copper King Ruling the Power Grid Supercycle
A successful Southern Copper chart analysis requires understanding the company’s monopolistic position in the raw materials market. SCCO boasts one of the largest copper reserves in the world, generating massive free cash flow.
According to the latest Yahoo Finance SCCO data and commodity supply chain reports, the demand for copper is exploding due to data center expansions, aging power grid replacements, and EV adoption. However, new mine developments are severely delayed by environmental regulations. This tightening bottleneck is structurally driving up copper prices. This powerful macroeconomic tailwind creates a robust downward rigidity near $163 even during short-term chart corrections, serving as a solid pillar to maintain the long-term upward trajectory.
🧭 Technical Southern Copper chart analysis: Combining the Oversold Floor and Support
The true opportunity arises when blood flows due to market volatility. Our system indicators are currently sending a very clear “sniping preparation” signal on the SCCO chart.
1. Stoch RSI: Exhaustion of Selling Energy and the Birth of a Golden Cross
[System Setting: Daily 1D / 3, 3, 14, 14]
This is the most critical clue in today’s Southern Copper chart analysis. The indicator, which was descending from the overheated zone, has reached the abyss of an absolute oversold reading (below 20) at 6.08. This is a mechanical signal that market fear has peaked and short-term profit-taking supply has bottomed out. Notably, the blue K-line (6.08) is slightly piercing above the orange D-line (5.42), forming an initial golden cross pattern. This implies that the suppressed buying energy could explode soon.
2. Heikin Ashi: Wait for the End of the Red Wave
[System Setting: Daily 1D / Standard]
The Heikin Ashi candles are still continuously spitting out red bearish bodies. This means the inertia of the trend is still pointing downward. Even though the stochastic indicator has raised its head from the floor, do not hastily reach out to commit full position sizing until the candle color flips to green. The day the first green bullish candle appears is the definitive signal that smart money has grabbed the fleet’s steering wheel again.
3. SuperTrend: The Iron Wall Defense of the $163.77 Support
[System Setting: Daily 1D / 10, hl2, 3]
The current price is battling around the $167 level, and a formidable Green (Buy) SuperTrend support line is formed just below it at $163.77. Because the gap between the current price and the support line is very narrow, you can execute a trade with an exceptionally favorable risk-reward ratio by setting this line as a clear stop-loss (Risk Management) criterion. As long as $163 holds, the current position is the optimal swing entry point to comfortably ride the massive copper supercycle.
💡 StockArgo Insight: Predators Hunt with Their Backs to the Support Line
“When everyone dumps, crying that the commodity rally is over, we smile at the 6.08 system indicator and quietly raise our sniper scopes, our backs resting on the $163 iron wall support.”
The conclusion of today’s Southern Copper chart analysis is clear. There is no doubting the growth potential of SCCO, the copper mining leader benefiting the most from AI infrastructure expansion. The current price correction is a necessary engine cooling process to reach new all-time highs. Trust the extremely low 6.08 RSI reading and the defensive power of the $163.77 SuperTrend, and focus solely on the color change of the Heikin Ashi candles. The moment the system shouts ‘GO’ with a green candle, we will become the protagonists of another massive commodity rally from the safest possible position.
🔗 Related Analysis in US Stock Portfolio:
Vertiv Holdings (VRT) Chart Analysis: AI Cooling Mega-Cap Reaches Oversold Territory (2026.04.30)
* Disclaimer: This post is based on market conditions as of May 05, 2026, and is strictly for educational and chart analysis purposes. It is not financial advice. Please do your own research (DYOR).
* Data Source: TradingView / Yahoo Finance