Explore More US Stock Portfolio Analyses →
This Vertiv Holdings chart analysis dissects the daily (1D) pullback momentum and systemic entry points for VRT, the undisputed leader in AI data center thermal management. Welcome aboard as we cut through the retail noise to navigate the deep currents of institutional capital and systemic algorithms.
“The hotter Nvidia’s GPUs get, the more explosively Vertiv’s value shines.” As the world races for AI computation speed, high-performance cooling infrastructure to prevent data center meltdowns is no longer optional—it is a matter of survival.
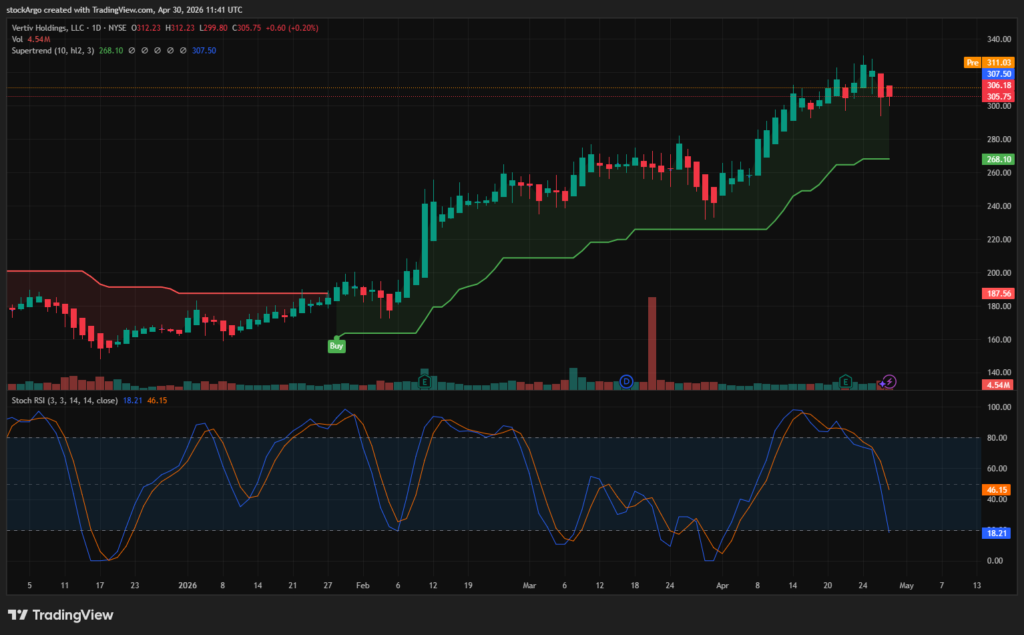
Our designated target for the [US Stock Portfolio] today is Vertiv Holdings (Ticker: VRT). On the daily (1D) chart, VRT has entered a picture-perfect pullback phase that sends a hunter’s adrenaline surging. The relentless upward rally that dominated the year has temporarily paused, initiating a healthy profit-taking wave to cool down short-term overheating. Crucially, our core system indicators have hit “rock bottom oversold” territory, signaling the exhaustion of selling pressure. Let’s dissect the energy compressing around the $305 level using our three core system indicators.
⏱️ 3-Second Executive Summary (1D Analysis)
| System Core Indicator | Analysis Status (Fact Check) | StockArgo Strategy |
|---|---|---|
| Stoch RSI (Daily 1D / 3, 3, 14, 14) | Currently at 18.21 / 46.15. The K-line has plunged deep below the 20 threshold, mechanically proving the exhaustion of short-term selling pressure. | 🔵 Await Oversold Snipe |
| Heikin Ashi (Daily 1D / Standard) | Due to rally fatigue, consecutive red bearish candles are appearing, executing a healthy price and time correction. | 🔴 Avoid Premature Chasing |
| SuperTrend (Daily 1D / 10, hl2, 3) | A formidable Green (Buy) support line is established way down at $268.10, leaving a significant gap from the current price action. | 💎 Entry Only After Reversal Signal |
🚀 Strategic Conclusion: This is an incredibly healthy engine cooling (pullback) phase for a massive AI market leader. With the Stochastic RSI hitting an extreme oversold reading of 18.21, rebound energy is brewing. However, due to the wide gap down to the SuperTrend support, volatility remains open. We must maintain patience and hunt only when the Heikin Ashi red candles stop and the first green reversal candle is confirmed.
📰 Fundamentals: Solving the Inevitable Bottleneck of the AI Era
A successful Vertiv Holdings chart analysis requires understanding the company’s impenetrable moat within its sector. VRT is not just a building contractor; it is the critical supplier of power and thermal infrastructure that keeps the AI revolution breathing.
According to the latest Yahoo Finance VRT data and semiconductor industry trends, next-generation AI chips consume exponentially more power and generate massive heat compared to their predecessors. Traditional air cooling has reached its physical limits, leading to an explosive surge in demand for Vertiv’s advanced liquid cooling solutions. This macroeconomic mega-trend acts as a formidable fundamental firewall, ensuring that massive institutional capital is always waiting to buy the dip during short-term supply-demand distortions.
🧭 Technical Vertiv Holdings chart analysis: Opportunity at the 18.21 Oversold Floor
The true opportunity arrives when profit-taking rains down on a relentless winner. Our system indicators are currently sending a very clear “sniping preparation” signal on the Vertiv chart.
1. Stoch RSI: The Tail End of the Selling Bombardment (18.21)
[System Setting: Daily 1D / 3, 3, 14, 14]
This is the most crucial clue in today’s Vertiv Holdings chart analysis. The indicator, which was radiating heat at the top, has plummeted into the abyss of the oversold zone, currently recording 18.21 on the K-line. This provides mechanical proof that the selling pressure from panicked short-term investors has scraped the bottom of the barrel. The moment this blue K-line curls up and pierces the orange D-line—forming a golden cross—the suppressed buying energy will detonate.
2. Heikin Ashi: The Patience to Wait for the Red Wave to End
[System Setting: Daily 1D / Standard]
The Heikin Ashi candles are currently spitting out red bearish candles with lower wicks. Even though the stochastic indicator has entered the floor zone, the inertia of the candles indicates the trend is still pointing downward. This is not the place to blindly yell “buy the dip.” Discipline is required: wait until the bodies of these red candles thin out and the first green bullish candle appears. That is the day to open all ports and initiate the hunt.
3. SuperTrend: The Massive Safety Net at $268
[System Setting: Daily 1D / 10, hl2, 3]
While the current price is battling around $305, the macro-uptrend-supporting Green (Buy) SuperTrend line is established way down at $268.10. The gap between the price and support is vast. While this signifies the sheer strength of the past trend, it also means there is room for volatility and a deeper correction down to the high $260s if the market shakes. Therefore, the smart strategy is to absolutely confirm the rebound signal (Heikin Ashi turning green) before approaching with split entries.
💡 StockArgo Insight: Taming the Best Stallions in the Oversold Zone
“While the crowd cheered the endless rise of Nvidia and Vertiv, we watched. Now, as the chart bleeds red and the Stoch drops to the 18s, we smile and raise our sniper scopes.”
The conclusion of today’s Vertiv Holdings chart analysis is clear. There is no doubting the growth potential of VRT, the beating heart of AI data center infrastructure. The current price correction is an essential engine-cooling process required to target new all-time highs. Trust the extremely low 18.21 RSI reading, and focus your attention solely on the Heikin Ashi color change. The moment the system shouts ‘GO’, we will safely board Act II of this massive AI infrastructure rally.
🔗 Related Analysis in US Stock Portfolio:
* Disclaimer: This post is based on market conditions as of April 30, 2026, and is strictly for educational and chart analysis purposes. It is not financial advice. Please do your own research (DYOR).
* Data Source: TradingView / Yahoo Finance