Explore More US Stock Portfolio Analyses →
This Coinbase chart analysis reveals the daily (1D) bearish turnaround and risk management strategies for COIN, the massive institutional liquidity gateway of the crypto market. Explorer StockArgo. Welcome aboard as we cut through the market noise to navigate the deep currents of systemic algorithms and institutional profit-taking.
“A massive red wall at $209 blocks the speeding train. Now is not the time for greed, but to dodge the sudden downpour of smart money profit-taking.” Even amidst the long-term digital asset rally, the chart is mechanically warning us that the engine is cooling down.
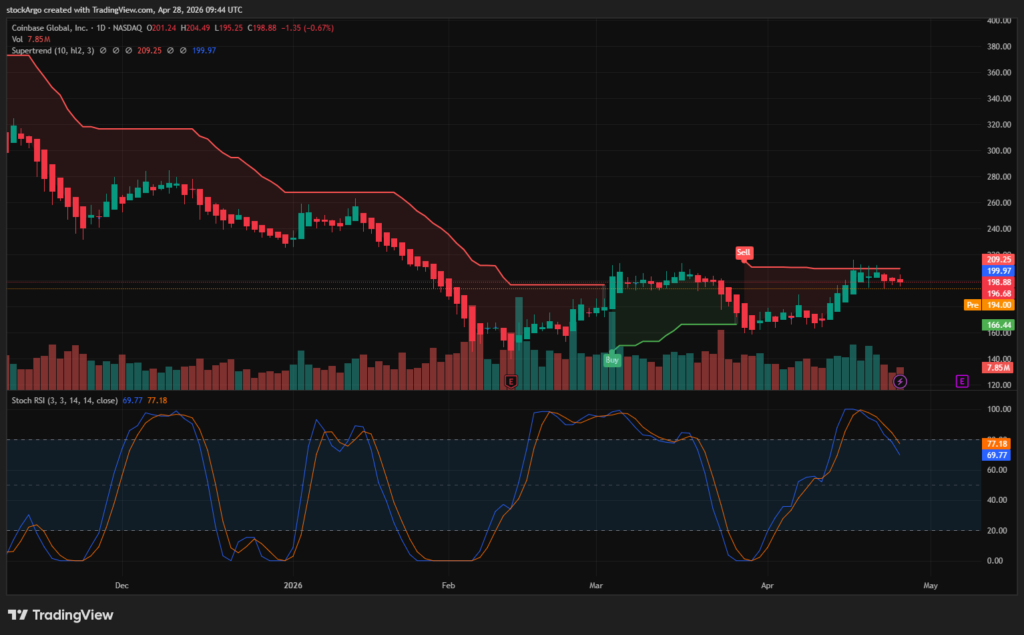
Our designated target for the [US Stock Portfolio] today is Coinbase Global (Ticker: COIN). On the daily (1D) chart, we are entering a highly strategic bearish reversal (wait-and-see) phase. Following months of explosive upward momentum, the current chart has slammed its head against a thick red resistance line and is undergoing a forced cooling process. Notably, one of our core system indicators has fired a clear ‘death cross,’ signaling a lethal risk for those who buy blindly. Let’s dissect the selling pressure around the $198 level using our three core system indicators.
⏱️ 3-Second Executive Summary (1D Analysis)
| System Core Indicator | Analysis Status (Fact Check) | StockArgo Strategy |
|---|---|---|
| Stoch RSI (Daily 1D / 3, 3, 14, 14) | Currently at 69.77 / 77.18. A clear death cross has formed as the K-line slices downward through the D-line near the overbought zone. | 🔴 Strictly Prohibit New Entries |
| Heikin Ashi (Daily 1D / Standard) | Following the green bullish rally, red bearish candles have emerged, mechanically confirming a short-term downward price correction. | ⚡ Consider Risk Management for Holders |
| SuperTrend (Daily 1D / 10, hl2, 3) | A massive Red (Sell) resistance line has formed above the price at $209.25, acting as a powerful ceiling suppressing the stock. | 💎 Wait on the Sidelines for Support |
🚀 Strategic Conclusion: This is a classic “profit-taking” phase where an upward rally has been broken by strong resistance. With the Stochastic RSI firing a death cross at 69.77, the downward pressure will likely intensify. Now is not the time to catch a falling knife with bare hands; it is the exact moment to stay warm on the sidelines until the Heikin Ashi red candles stop and the indicator fully hits the oversold floor (below 20).
📰 Fundamentals: The Hidden Shadow of Short-Term Overheating Behind Institutional Inflows
For a successful Coinbase chart analysis, one must be able to separate the massive macro vision of the company’s fundamentals from the short-term speculative psychology hiding behind it.
According to the latest Yahoo Finance COIN data and global financial reports, Coinbase essentially monopolizes the custody services for Bitcoin and Ethereum spot ETFs, reaping the explosive benefits of Wall Street institutional inflows. This powerful industry tailwind guarantees a long-term upward trajectory. However, to a system trader, “good in the long term” does not mean “good to buy right now.” When retail investors dive in like moths to a flame intoxicated by bullish news, smart money (institutions) will reliably offload their holdings, creating a sudden downpour of short-term profit-taking.
🧭 Technical Coinbase chart analysis: Dodge the Sudden Downpour
Selling pressure is emerging in the wake of the Bitcoin rally’s euphoria. Our system indicators are currently sending a very clear “warning signal” on the COIN chart.
1. Stochastic RSI: Exhaustion of Buying Energy and the Death Cross
[System Setting: Daily 1D / 3, 3, 14, 14]
This is the most critical clue in today’s Coinbase chart analysis. The indicator, which was attempting to push into the overbought zone while radiating upward energy, failed to break the ceiling and bent downwards. Currently recording 69.77 / 77.18, a definitive ‘death cross’ has occurred as the blue K-line slices down through the orange D-line. This is a mechanical signal that buying energy is exhausted and the price has a high probability of cascading downward following the indicator.
2. Heikin Ashi: Beware the Start of the Red Wave
[System Setting: Daily 1D / Standard]
The Heikin Ashi candles have ended their crisp green upward rally and begun spitting out red bearish candles. This signifies that the inertia of the trend has completely flipped from upward to downward. Reaching out right now shouting “buy the dip” is extremely dangerous. You must exercise absolute patience until the size of these red candles shrinks and they turn back to green.
3. SuperTrend: The Ruthless Pressure of the $209 Resistance
[System Setting: Daily 1D / 10, hl2, 3]
The current price has been pushed back to the $198 level, and right above it lies a massive Red (Sell) SuperTrend resistance line at $209.25. Recently, the price attempted a rebound but accurately bumped its head against this iron-clad resistance and bounced back down. As long as this thick ceiling exists, it is highly likely that the price will slide down to the lower support blocks, undergoing a deeper price correction.
💡 StockArgo Insight: A True Hunter Enjoys the Wait
“When the crowd blindly headbutted the $209 resistance intoxicated by good news, we sold. Now, with the indicator bending into a 69.77 death cross, we hold our cash, smile, and observe.”
The conclusion of today’s Coinbase chart analysis is clear. COIN’s long-term fundamentals, holding the purse strings of global asset managers, are excellent. However, the current price correction is a ruthless profit-taking process by market whales to cool down an overheated engine. Trust the RSI death cross, and stay on the sidelines until the red Heikin Ashi wave concludes. The moment the system shouts ‘GO’ again from the oversold Stochastic floor (below 20), we will jump back onto the massive rally from the safest possible position.
🔗 Related Analysis in US Stock Portfolio:
* Disclaimer: This post is based on market conditions as of April 28, 2026, and is strictly for educational and chart analysis purposes. It is not financial advice. Please do your own research (DYOR).
* Data Source: TradingView / Yahoo Finance