Explore More US Stock Portfolio Analyses →
This Arm Holdings chart analysis provides a deep dive into the explosive macro breakout and the extreme overheating signals of the hidden king of AI hardware. Explorer StockArgo. Welcome aboard as we navigate the massive currents of global capital and systemic algorithms.
“AI is escaping the cloud and entering your pocket: The On-Device AI revolution.” As BBC Tech highlights, AI is no longer confined to massive data centers; it is moving directly into smartphones and laptops. This revolution is impossible without the energy-efficient architecture of ARM, which controls 99% of the world’s mobile chip designs.
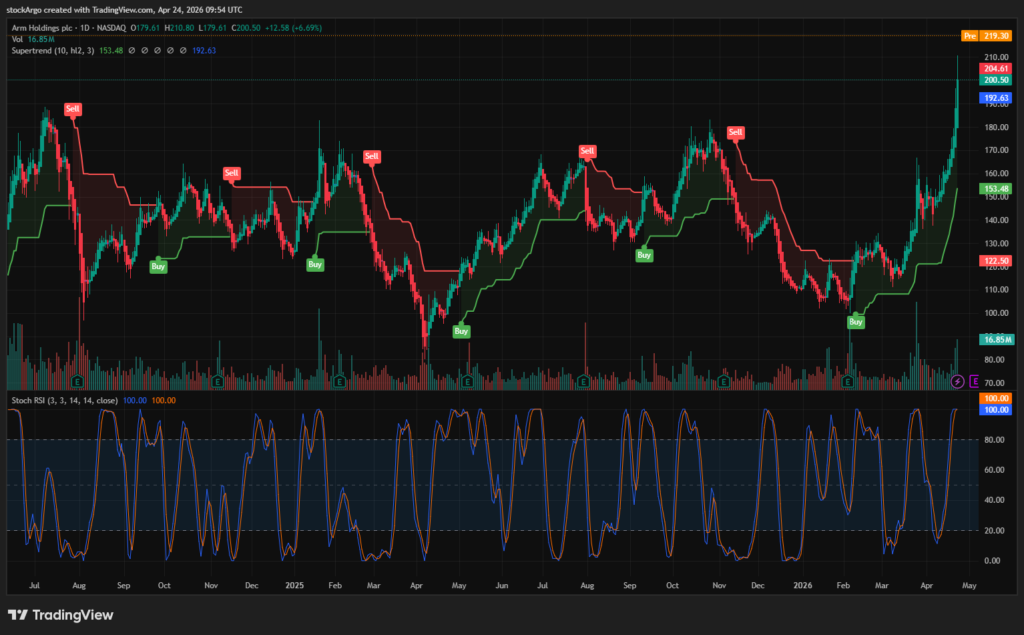
Our focus today in the US Stock Portfolio is Arm Holdings (Ticker: ARM). The daily (1D) chart is displaying price action that can only be described as “insane,” shattering long-term resistance for a massive macro breakout. However, our system indicators are also flashing red warnings of extreme overheating. Let’s dissect this explosive trend and the risks of chasing this rally using our 3 core system indicators.
⏱️ 3-Second Executive Summary (Daily Analysis)
| System Core Indicator | Analysis Status (Fact Check) | StockArgo Strategy |
|---|---|---|
| SuperTrend (Daily 1D / 10, hl2, 3) | Smashed the long-term resistance near $192.63 and flipped to a Green (Buy) signal. The macro uptrend is officially launched. | 🔵 Macro Trend Confirmed |
| Heikin Ashi (Daily 1D / Standard) | Following a consolidation, consecutive wickless green candles have appeared. Buying energy has exploded. | 🟢 Strong Buying Strength |
| Stoch RSI (Daily 1D / 3,3,14,14) | Both K and D lines have hit 100.00. This is a “ceiling flat-lining” state, indicating extreme overheating. | 🔴 Avoid FOMO Chasing |
🚀 Strategic Conclusion: This is a textbook macro breakout. While the SuperTrend screams “BUY,” the Stoch RSI sitting at 100 warns of a very risky short-term overheat. A disciplined hunter should avoid chasing the peak and instead wait for a pullback to the newly formed $192 support level or for the RSI to cool down before entering.
📰 Fundamentals: The IP King Controlling 99% of Mobile AP Designs
The business media landscape, including BBC, is currently forecasting a paradigm shift in the AI chip market. While Nvidia dominates the “brains” of massive data centers, we are now entering the era of “On-Device AI,” where AI runs directly on consumer electronics.
The undisputed ruler of the intellectual property (IP) for these devices is Arm Holdings (ARM). Almost all mobile application processors (APs) in smartphones and laptops are built on ARM’s architecture. As the world shifts toward AI-capable devices, the demand for ARM’s latest v9 architecture—which commands significantly higher royalty rates than previous generations—is skyrocketing. This structural shift ensures that as AI goes mobile, ARM’s royalty revenue will expand exponentially, fulfilling every requirement for an explosive mega-cap growth stock.
🧭 Technical Arm Holdings chart analysis: Macro Breakout vs. Overheated Ceiling
Armed with fundamental conviction, we must now use system indicators to navigate the massive capital flows. Our Arm Holdings chart analysis balances the macro structural shift on the daily chart with the warning signs from short-term momentum oscillators.
1. SuperTrend Breakout: The Macro Shift
[System Setting: Daily 1D / 10, hl2, 3]
The most significant development is the structural breakout. The oppressive red resistance line that had capped ARM for months has been shattered with massive volume. The SuperTrend has officially flipped to Green (Buy), breaking past the $192.63 psychological barrier to reach the $200 handle. This is the systemic confirmation that the bearish cycle is dead and a new AI-driven rally has launched.
2. Heikin Ashi: Visualizing Massive Buying Pressure
[System Setting: Daily 1D / Standard]
Simultaneous with the SuperTrend flip, the Heikin Ashi candles have shown a decisive change. The sequence of red bearish candles has been completely replaced by consecutive, wickless green candles. This isn’t just a price increase; it is a visual proof that institutional buyers have overwhelmed all sellers, unleashing a torrent of upward momentum.
3. Stochastic RSI: The 100.00 Overheating Alert
[System Setting: Daily 1D / 3, 3, 14, 14]
This is the critical warning point of today’s analysis. Observe the levels: both the K and D lines have hit 100.00. This “ceiling flat-lining” indicates that the buying energy is extremely overextended. No matter how strong the trend, an RSI of 100 on the daily chart almost always precedes a short-term correction or a period of sideways consolidation. Chasing at this exact moment is a high-risk gamble.
💡 StockArgo’s Strategy: Macro Conviction, Micro Patience
“The macro trend has set the sails, but the engine is currently redlining at 100% capacity.”
The conclusion of our Arm Holdings chart analysis is simple: the macro trend is undeniably bullish, but the current entry is dangerously overheated. ARM’s long-term dominance in the On-Device AI market is clear, and the SuperTrend breakout is a legitimate signal of future growth.
However, a professional hunter does not chase at the peak. Wait for the price to return to the $192 support zone—formerly the resistance—or wait for the Stoch RSI to cool down from the 100 ceiling. By exercising patience, you can join the macro uptrend at a much safer price point, staying true to the principle of “preserving capital while capturing gains.”
🔗 Related Analysis in US Stock Portfolio:
Eli Lilly (LLY) Chart Analysis: The Mega-cap’s Perfect Range Consolidation (2026.04.23)
* Disclaimer: This post is based on market conditions as of April 24, 2026, and is strictly for educational and chart analysis purposes. It is not financial advice. Please do your own research (DYOR).
* Data Source: TradingView / Nasdaq