Explore More US Stock Portfolio Analyses →
This Eli Lilly chart analysis aims to identify the optimal entry point within the current consolidation phase of the world’s leading pharmaceutical giant. Explorer StockArgo. Welcome as we navigate the massive currents of global capital and systemic algorithms.
“Weight-loss drugs are not just medicine; they are a revolution shifting the global economy.” As global media outlets highlight, the $1 trillion giant Eli Lilly is currently in a healthy consolidation phase after a historic rally.
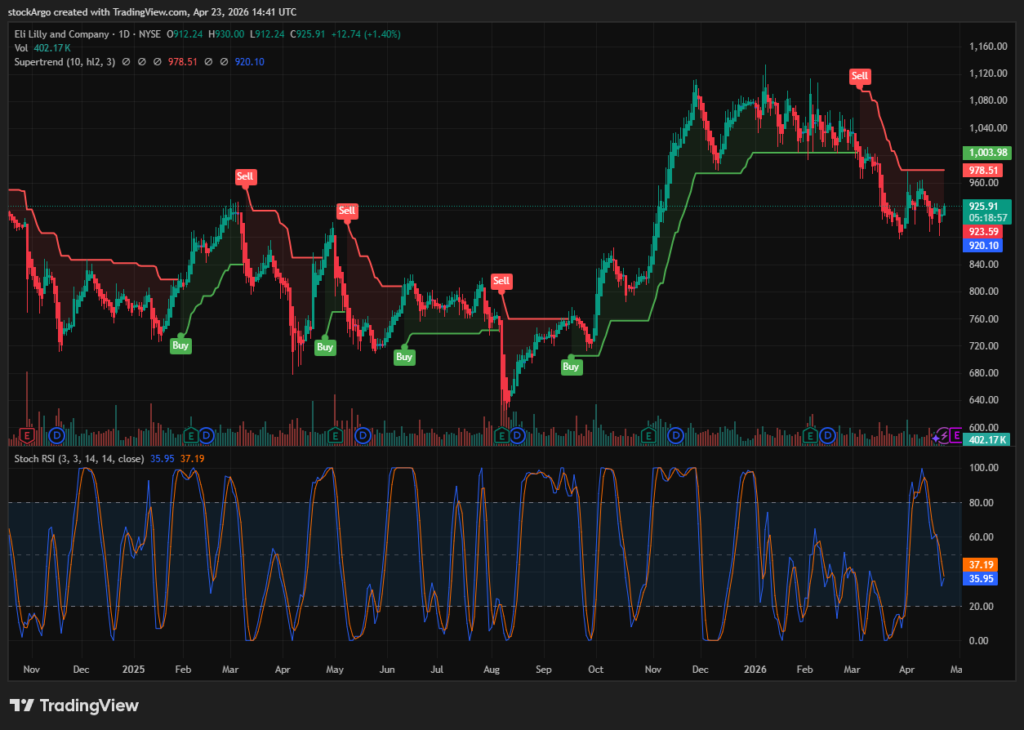
Today’s Eli Lilly chart analysis focuses on the daily (1D) timeframe. This is not a bearish collapse; it is a textbook “energy recharge” phase where the stock digests previous gains. By using our emotionless system indicators, we will dissect how to safely hunt the bottom of this massive consolidation range. Let’s dive into the technical details.
⏱️ 3-Second Executive Summary (Daily Analysis)
| System Core Indicator | Analysis Status (Fact Check) | StockArgo Strategy |
|---|---|---|
| Stoch RSI (Daily 1D / 14, 3, 3) | Currently at 35.67 / 37.10. Formed a bullish golden cross after hitting the oversold floor. | 🟢 Rebound Momentum Starting |
| Heikin Ashi (Daily 1D / Standard) | The red bearish wave has halted, and a wickless green candle has appeared, signaling a turnaround. | 🔵 Range Bottom Support |
| SuperTrend (Daily 1D / 10, 3) | A firm Red (Sell) resistance line is established at $978.51, serving as a clear ceiling for the current range. | 💎 Target: $978 Resistance |
🚀 Strategic Conclusion: This is a perfect “time correction” following a massive rally. With the Stoch RSI crossing up from the bottom and a green candle appearing near $925, the strategy is to buy the range bottom and target the SuperTrend resistance at $978 for a low-risk swing trade.
📰 Fundamentals: The GLP-1 Revolution Fueling Mega-cap Growth
Before relying on our Eli Lilly chart analysis, we must validate why this giant is consolidating rather than collapsing. Fundamental backing is essential for high-conviction trades.
Eli Lilly is currently redefining the pharmaceutical landscape with its blockbuster GLP-1 drugs, Zepbound and Mounjaro. According to the official Eli Lilly (LLY) investor relations and global healthcare reports, demand is so high that the company is operating at maximum capacity 24/7. Outside of AI, no other sector is attracting global capital as aggressively as weight-loss therapeutics. This consolidation on the daily chart is simply a digestion period for previous gains, building the necessary energy for the next leg up in this secular bull cycle.
🧭 Technical Eli Lilly chart analysis: Mastering the Range
When a mega-cap stock enters a sideways range, trend-following strategies fail. Instead, we must pivot to a “buy the bottom” approach. Our Eli Lilly chart analysis uses a combination of indicators to maximize probability.
1. Stochastic RSI: The Golden Cross at the Floor
[System Setting: Daily 1D / 14, 3, 3]
This is the most reliable indicator for range-bound markets. After hovering in the oversold zone for days, the Stochastic RSI is currently at 35.67 / 37.10 and crossing upward. This mechanically proves that selling exhaustion has reached its peak and buyers are returning to the $920-$925 support zone.
2. Heikin Ashi: Confirming the Local Bottom
[System Setting: Daily 1D / Standard]
Heikin Ashi filters the noise to show the true direction of momentum. The sequence of red bearish candles has finally broken, replaced by a wickless green candle. This indicates that institutional buyers have established a firm defensive line at the bottom of the current range, signaling that the price is unlikely to fall further in the short term.
3. SuperTrend: A Disciplined Exit Strategy
[System Setting: Daily 1D / 10, 3]
The SuperTrend is currently flashing a Red (Sell) signal with a resistance line at $978.51. This provides us with a crystal-clear target. Entering near the $925 support and exiting as the price approaches the $978 resistance level offers an exceptional risk-to-reward ratio for a mega-cap swing trade.
💡 StockArgo’s Strategy: Profiting from the Giants’ Rest
“When a giant rests, the patient hunter prepares. Buy the support, sell the resistance, and follow the system.”
In conclusion, our Eli Lilly chart analysis suggests that now is the time to accumulate. The $1 trillion giant is not breaking down; it is simply catching its breath. With the Stoch RSI crossing up and Heikin Ashi turning green, the probability of a move toward the $978 resistance is high. Maintain discipline and follow the system’s guidance to harvest profits from this mega-cap consolidation.
🔗 Related Analysis in US Stock Portfolio:
Recursion Pharmaceuticals (RXRX) Chart Analysis: Nvidia’s Ultimate Tech-Bio Bet (2026.04.22)
* Disclaimer: This post is based on market conditions as of April 23, 2026, and is strictly for educational and chart analysis purposes. It is not financial advice. Please do your own research (DYOR).
* Data Source: TradingView / Nasdaq
“Eli Lilly (LLY) Chart Analysis: The Mega-cap’s Perfect Range Consolidation (2026.04.23)”에 대한 1개의 생각