Explore More US Stock Portfolio Analyses →
Explorer StockArgo. The purpose of this NuScale Power SMR chart analysis is to cut through the market noise and identify the optimal entry point for the next big AI narrative within our [US Stock Portfolio].
Global media like the BBC are sounding the alarm: “AI is devouring electricity.” No matter how powerful Nvidia’s GPUs are, they are useless without massive amounts of power. This is exactly why Big Tech is pouring billions into next-generation nuclear energy.
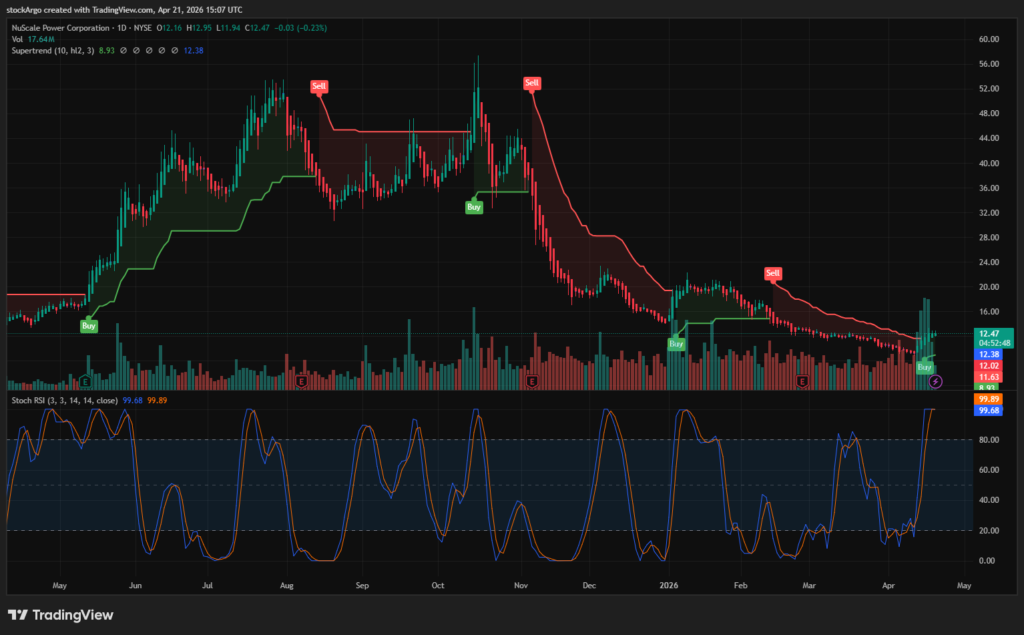
In this comprehensive NuScale Power SMR chart analysis, we will evaluate the daily (1D) timeframe. The stock has broken out of a grueling downtrend and flashed a massive systemic reversal signal. Let’s decode whether it’s time to jump in or wait, using our emotionless system indicators.
⏱️ 3-Second Executive Summary (1D Analysis)
| System Core Indicator | Analysis Status (Fact Check) | StockArgo Strategy |
|---|---|---|
| Heikin Ashi (Daily / Standard) | Massive green candles with zero lower wicks. The selling pressure has been completely absorbed, showing explosive upward momentum. | 🟢 Strong Buying Power |
| Stoch RSI (Daily / 14, 3, 3) | Currently maxed out at 100.00 / 100.00. The short-term momentum engine is in extreme overbought territory. | 🔴 Strict No Chase Zone |
| SuperTrend (Daily / 10, 3) | Shattered the long-term resistance line and officially flipped to a Green (Buy) signal, establishing a new support base. | 🔵 Macro Reversal Confirmed |
🚀 Strategic Conclusion: The macro trend reversal is an undeniable fact. However, with the Stoch RSI pegged at 100, buying at the current market price is extremely risky. Patience is required to wait for a healthy pullback to the newly formed SuperTrend support line.
📰 Fundamentals: Big Tech’s Bet on Next-Gen Nuclear Energy
Before diving deeper into our NuScale Power SMR chart analysis, we must verify the fundamental catalyst driving this breakout via an outbound fact check.
Major tech giants like Microsoft, Amazon, and Google are desperately seeking dedicated, carbon-free power sources to build massive AI data centers. Traditional nuclear plants take decades to build, making Small Modular Reactors (SMRs) the only viable solution. According to the NuScale Power official website, they are the first and only company to receive design certification from the U.S. Nuclear Regulatory Commission (NRC). As the AI power crisis deepens, NuScale’s fundamental valuation is poised for a massive re-rating.
🧭 Technical NuScale Power SMR chart analysis: The Daily Breakout
Having a great fundamental story is useless if your entry timing is wrong. Our NuScale Power SMR chart analysis relies on three specific indicators to balance the macro breakout with micro risk management.
1. Heikin Ashi (Daily / Standard)
Looking at the Heikin Ashi candles on the daily chart, we observe a powerful sequence of wickless green candles. In our system, the absence of lower wicks signifies that buyers are aggressive and sellers have completely stepped aside. This visual confirms that the market psychology has shifted from fear to overwhelming accumulation.
2. Stochastic RSI (Daily / 14, 3, 3)
This is where our NuScale Power SMR chart analysis flashes a warning. The Stochastic RSI is currently locked at 100.00. The momentum rubber band is stretched to its absolute physical limit. Historically, buying a stock when the daily Stoch RSI is at 100 almost always results in suffering through a short-term drawdown as profit-takers exit the market. We must let the engine cool down.
3. SuperTrend (Daily / 10, 3)
The most critical finding in our NuScale Power SMR chart analysis is the SuperTrend indicator. The oppressive red resistance line that dominated the chart for months has finally been destroyed on high volume. The indicator has flipped to a Green (Buy) support line. This is the systemic confirmation that the long-term bear market is over and a new bull cycle has officially started.
💡 StockArgo’s Strategy: The Art of the Pullback
“The trend confirms the destination, but your patience dictates your profitability.”
To conclude this NuScale Power SMR chart analysis, the reversal is real, but the timing requires discipline. We will not chase the green candles. We are waiting for the Stoch RSI to drop from 100 down toward the oversold 20 level. When the price inevitably pulls back to test the new Green SuperTrend support line, that will be our high-conviction, low-risk entry point to ride the AI energy supercycle.
🔗 Related Analysis in US Stock Portfolio:
SentinelOne (S) Chart Analysis: The AI Shield Reversal (2026.04.20)
* Disclaimer: This post is based on market conditions as of April 21, 2026, and is strictly for educational and chart analysis purposes. It is not financial advice. Please do your own research (DYOR).
* Data Source: TradingView / Nasdaq