Explore More US Stock Portfolio Analyses →
Philadelphia Semiconductor Index (SOX) chart analysis is the ultimate compass for navigating the AI revolution. Welcome to StockArgo, where we cut through the market noise to reveal true macroeconomic trends.
Who makes the most money in a casino? It is never the lucky gambler who hits the jackpot. It is the ‘House’—the owner of the casino itself.
Trying to predict whether Nvidia, AMD, or TSMC will be the ultimate winner of the AI hardware war is an exhausting and risky endeavor. Today, our focus shifts to a strategy that eliminates individual stock risk by owning the entire ecosystem: the Philadelphia Semiconductor Index (SOX).
By dissecting the fundamental moat of this index and applying our emotionless technical system, we will perform a precise chart analysis to understand where the global semiconductor market is heading next.
⏱️ 3-Second Executive Summary
“The macro uptrend has ignited, but the momentum is boiling over. Wait for the cooldown.”
- Fundamentals (The Ecosystem): The SOX index tracks the 30 largest semiconductor companies globally, including NVDA, TSMC, ASML, and AMAT. It is the most direct and diversified way to invest in the AI infrastructure supercycle.
- System Strategy (Chart Analysis): The SuperTrend has finally broken resistance and flipped to ‘Green (Bullish)’. However, short-term momentum (Stoch RSI) is pegged at 100.00, indicating extreme overbought conditions. Patience is required for a healthy pullback.
| System Indicator (Daily) | Current Status (Fact Check) | StockArgo Action |
|---|---|---|
| Price Action | Massive bullish breakout candle breaking previous highs with near-vertical momentum. | 🟢 Strong Upward Momentum |
| SuperTrend | Flipped to a Green (Buy) signal near the 8,227.77 point level, officially ending the macro correction. | 🔵 Macro Bull Trend Established |
| Stoch RSI | Currently pegged at 100.00 / 100.00. Absolute maximum level indicating extreme overbought conditions. | 🔴 Avoid FOMO Chasing |

📰 Fundamentals: Do Not Pick Winners, Own the Ecosystem
To fully grasp the power of the Philadelphia Semiconductor Index (SOX), we must understand why it remains one of the most formidable investment vehicles of our generation.
1. The Ultimate Semiconductor Value Chain
The semiconductor industry is highly fragmented into design (fabless), manufacturing (foundry), equipment, and packaging. If a single link breaks, the chips cannot be made. The SOX Index tracks the 30 largest semiconductor companies (Nasdaq Official), encompassing the entire global value chain. This built-in diversification acts as a robust shield against individual corporate failures.
2. The Direct Beneficiary of the AI Supercycle
For software (AI) to become smarter, hardware must scale exponentially. As global tech giants pour trillions into AI supremacy, that capital flows directly into the revenue streams of the companies within the SOX index. Owning this index is akin to collecting a toll on the Fourth Industrial Revolution.
🧭 Technical Chart Analysis: Surviving the Volcanic Eruption
Even the greatest fundamentals can lead to bleeding portfolios if entries are poorly timed. Let’s decode the StockArgo system indicators to perform a rational chart analysis of the current market state.
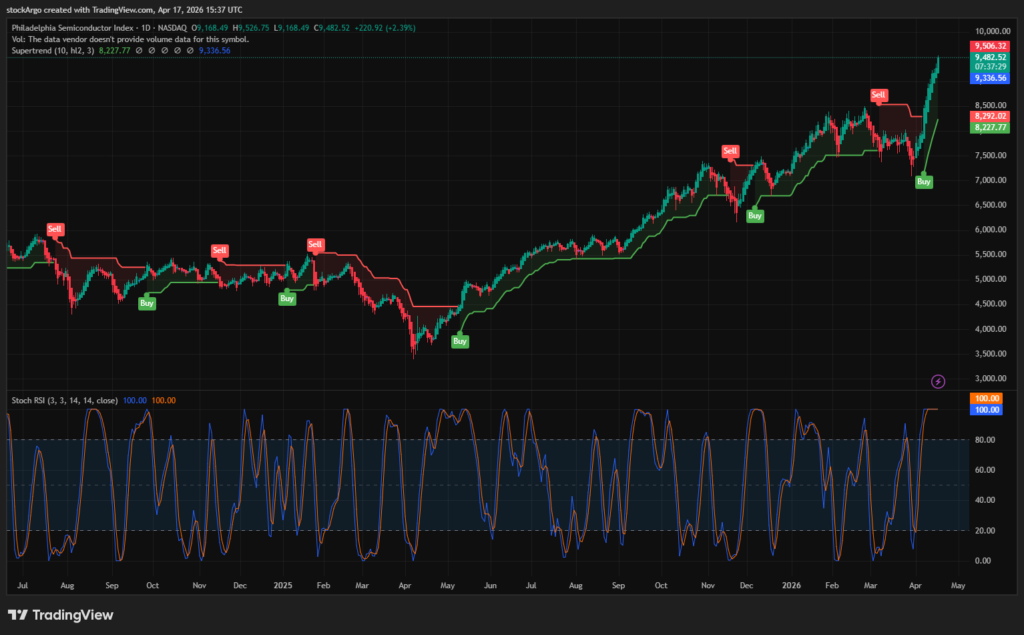
Step 1: The Macro Trend Reversal (SuperTrend)
The most critical bullish signal on the chart is the SuperTrend. After suppressing the index for an extended period, the red resistance line has been forcefully broken. The indicator has flipped to a bright Green ‘Bullish’ signal around the 8,227 point mark. This confirms that the prolonged correction is over and a new macro uptrend has officially launched.
Step 2: The Red Alert (Stochastic RSI)
However, we must look beneath the surface of this vertical rally. The Stoch RSI oscillator is currently locked at 100.00 / 100.00. The momentum rubber band is stretched to its absolute physical limit, screaming extreme overbought conditions. Chasing the market at these dizzying heights is essentially providing exit liquidity for institutional profit-taking.
Step 3: The High-Probability Strategy
What is the optimal move? The most mathematically sound strategy is to wait. Within the next few trading sessions, the market will naturally digest these gains, causing the price to pull back. We are looking for the Stoch RSI to cool off and approach the 20 (oversold) line. If the index price can retest and hold above the newly formed Green SuperTrend support line, that is where you deploy your capital for the next massive upward wave.
💡 StockArgo’s Insight: How to Trade the Index via ETFs
“The safest vessel is not a single stock, but a ship built to ride the macroeconomic currents of the ocean itself.”
You cannot buy the SOX index directly. To capture its performance, you must utilize exchange-traded funds (ETFs). The SOXX (iShares Semiconductor ETF) is the premier vehicle that meticulously tracks this index.
Alternatively, if you wish to take a slightly more aggressive stance heavily weighted toward the ultimate AI hardware kings (Nvidia and TSMC), the SMH (VanEck Semiconductor ETF) is a phenomenal substitute.
When the technical pullback we discussed finally materializes, consider making SOXX or SMH the unshakable core of your portfolio.
🚀 Master the AI Hardware Ecosystem
Why is the SOX index rising? Dive into the technical setup of the #1 equipment provider holding up the entire ecosystem.[Semiconductor Equipment Leader] AMAT Chart Analysis
* Disclaimer: This post is based on market conditions as of April 18, 2026, and is for educational purposes only. It is not financial advice. DYOR.
* Data Source: TradingView / Nasdaq