Explore More US Stock Analyses →
Let me ask you a question. During the California Gold Rush of the 1850s, who actually amassed the greatest fortunes? It wasn’t the miners digging in the dirt. It was the merchants who sold them the picks, shovels, and denim jeans.
Welcome to StockArgo. Today, we are focusing our radar on the undisputed “pick and shovel” merchant of the 21st-century artificial intelligence gold rush. If Nvidia’s valuation makes you hesitate, or if picking the ultimate winner between TSMC and Samsung feels too risky, the answer lies in the company that supplies the essential machinery to all of them: Applied Materials (NASDAQ: AMAT).
In this deep dive, we will explore the impenetrable fundamental moat of this semiconductor equipment giant and deploy our system charts to decipher the exact, risk-adjusted AMAT stock buy timing.
⏱️ 3-Second Executive Summary
“Nvidia designs the chips, TSMC makes them, but neither can operate without Applied Materials’ machines.”
- Fundamentals (The Moat): AMAT is the world’s #1 semiconductor equipment supplier. The transition to next-generation 2nm nodes and Gate-All-Around (GAA) transistor structures exponentially increases the demand for their deposition and etch tools.
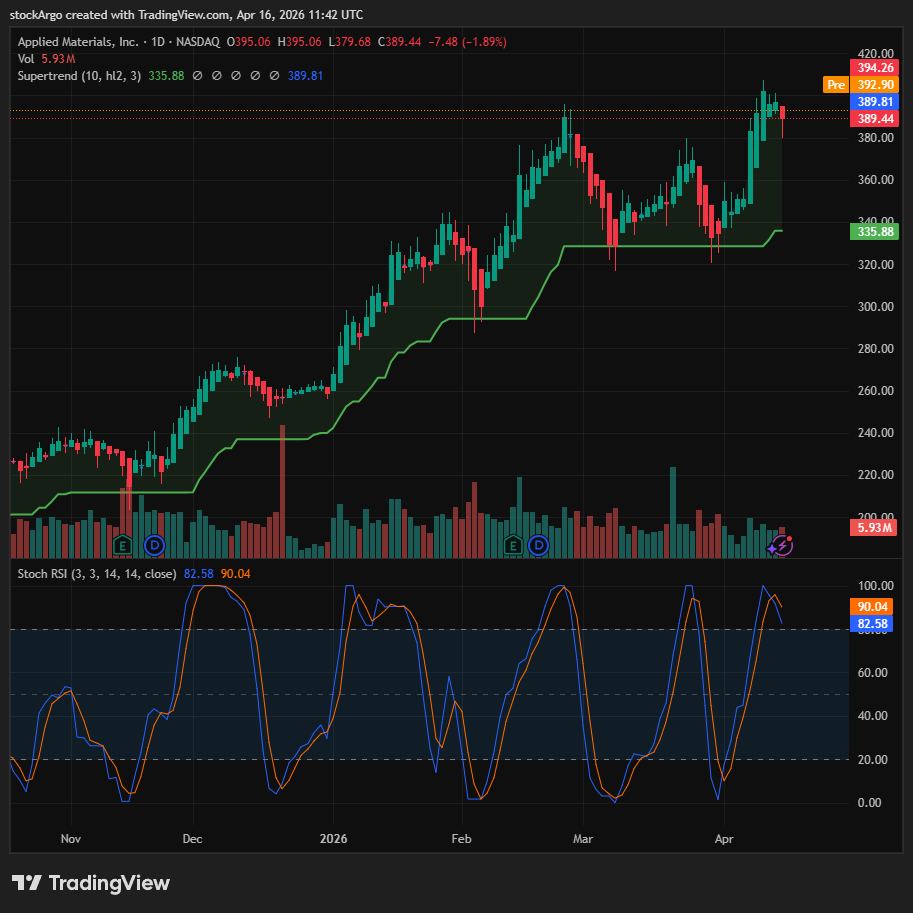
- System Strategy (Wait for Pullback): The macro uptrend is fully intact. However, after a massive rally, the stock is taking a healthy breather. The Stoch RSI is cooling down from overbought levels, signaling that a perfect “buy the dip” opportunity is approaching within days.
| System Indicator (Daily) | Current Status | StockArgo Action |
|---|---|---|
| Price Action | Red candles are appearing after a steep rally. Short-term profit-taking is underway, allowing the chart to consolidate healthily. | 🟡 Wait for Consolidation |
| Stoch RSI | Currently at 82.58 / 90.04. Formed a bearish cross in the overbought zone and is rapidly sliding toward the 20 (oversold) line. | 🟡 Prepare to Reload |
| SuperTrend | The solid Green (Buy) support line is firmly established around the $335.88 level. Long-term trend remains unbothered. | 🔵 Trust the Support Floor |

📰 Fundamentals: The Irreplaceable Vendor of the Silicon Age
Before we look at the charts, we must understand why Applied Materials deserves to be a core holding in your portfolio. When investors think of the AI revolution, they immediately envision Nvidia GPUs. But how do those GPUs go from a blueprint to a physical product? They require silicon foundries, and those foundries cannot operate for a single day without Applied Materials’ state-of-the-art machinery.
1. The Supermarket of Semiconductor Equipment
While ASML holds a monopoly in extreme ultraviolet (EUV) lithography (drawing the patterns), AMAT dominates almost everything else. They are the global leader in materials engineering solutions—specifically deposition (adding layers) and etch (removing layers). For giants like TSMC, Samsung, and Intel, it is far more efficient to buy an integrated suite of machines from AMAT rather than piecing together tools from dozens of smaller vendors. This creates a phenomenal vendor lock-in effect.
2. The GAA (Gate-All-Around) Catalyst
As the industry pushes toward 2nm nodes, shrinking transistors on a flat plane is no longer physically viable. The industry is transitioning to a 3D architecture called Gate-All-Around (GAA). This transition is incredibly complex and requires significantly more advanced deposition and etching steps per wafer. Simply put: the more advanced the chip, the more money AMAT extracts per wafer manufactured.
🧭 Technical Analysis: Patience Reveals the Perfect Entry
A compelling narrative can trap you if you buy at the wrong price. Emotional FOMO buying is the enemy of the system trader. Let’s consult the StockArgo system to pinpoint the most mathematically advantageous AMAT stock buy timing.
Step 1: The Healthy Pullback (Price Action & SuperTrend)
The macroeconomic trend for AMAT is beautifully bullish. We have a thick, green SuperTrend ‘Buy’ line acting as a concrete floor near the $335.88 level. However, after breaking out to new highs, the stock is naturally printing red candles. This is not a trend reversal; this is the market taking a breath, shaking out weak hands, and digesting recent gains.
Step 2: The System Trader’s Radar (Stochastic RSI)
This indicator is exactly why you shouldn’t hit the “Buy” button today. Look at the Stochastic RSI. It recently peaked in the overbought zone (above 80) and has now formed a bearish cross, sliding rapidly downward with readings around 82 and 90. The momentum rubber band, which was stretched to its limit during the rally, is now relaxing. As system traders, we do not waste our capital in the middle of a cooldown.
Step 3: The Golden Scenario
Within the next few trading sessions, the Stoch RSI will plunge into the oversold territory (below 20). We are waiting for the exact moment when the blue line pierces back up through the orange line—a Bullish Golden Cross. If this cross occurs while the price bounces off the green SuperTrend support line, you have just identified the ultimate AMAT stock buy timing. The downside risk will be strictly defined, and the upside potential will be immense.
💡 StockArgo’s Insight: Complete the AI Ecosystem Puzzle
“Great investing isn’t about buying a single tree; it’s about owning the entire forest ecosystem. The power is supplied, the servers are cooled, and the chips are forged.”
Your portfolio puzzle is coming together beautifully. Previously, we secured the power supplier (NextEra Energy) and the critical cooling infrastructure (Trane Technologies). Today, we added the ultimate pick-and-shovel merchant, Applied Materials, to the very top of our watchlist.
When the Stoch RSI hits the floor and flashes green, execute your AMAT stock buy timing without hesitation. Make it the sharpest spear in your portfolio. Victory belongs to the patient.
🚀 Master the AI Value Chain
How do we power and cool the chips AMAT helps create? Explore our deep dives into the rest of the AI infrastructure ecosystem.
[Power] NEE Chart Analysis[Cooling] TT Chart Analysis
* Disclaimer: This post is based on market conditions as of April 16, 2026, and is for educational purposes only. It is not financial advice. DYOR.
* Data Source: TradingView / Yahoo Finance / Applied Materials IR